Chapter 9 SSYK 214
9.1 Average monthly salary, SEK by region
Genomsnittlig grund- och månadslön samt kvinnors lön i procent av mäns lön efter region sektor, yrkesgrupp (SSYK 2012) och kön. År 2014 - 2018 Månadslön Samtliga sektorer 214 Cilvilingenjörsyrken Kön totalt 2017
readfile ("000000CG_1.csv") %>%
  left_join(nuts, by = c("region" = "NUTS2")) %>%
  right_join(map_ln_n, by = c("Länskod" = "lnkod_n")) %>%
  ggplot() +
    geom_polygon(mapping = aes(x = ggplot_long, y = ggplot_lat, group = lnkod, fill = relsalary)) +
coord_equal() 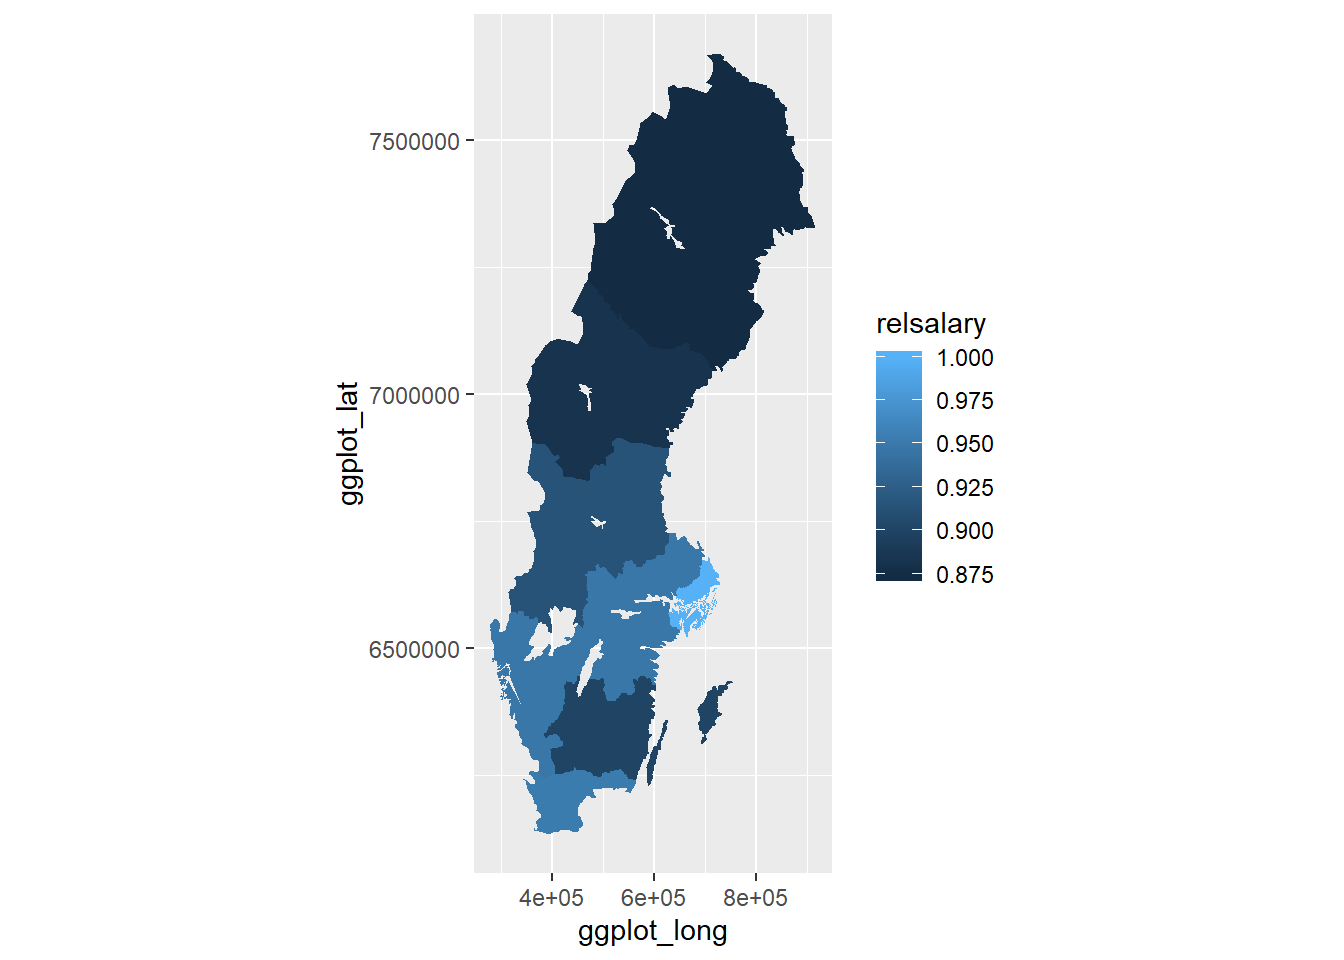
Figure 9.1: Engineers salaries in the different countys
salary_2017 <- readfile ("000000CG_1.csv") %>%
  left_join(nuts, by = c("region" = "NUTS2"))

readfile ("000000NL_3.csv") %>%
  group_by (`region`, year) %>%
  summarise (perc_women = perc_women (salary)) %>%
  mutate(perc_women_n = as.numeric(sub("%", "", perc_women))) %>%
  mutate(lnkod_n = as.numeric(substr(region, 1,2)))%>%
  right_join(salary_2017, by = c("lnkod_n" = "Länskod")) %>%
  ggscatter(x = "relsalary", y = "perc_women_n",
    add = "reg.line", conf.int = TRUE,
cor.coef = TRUE, cor.method = "pearson") 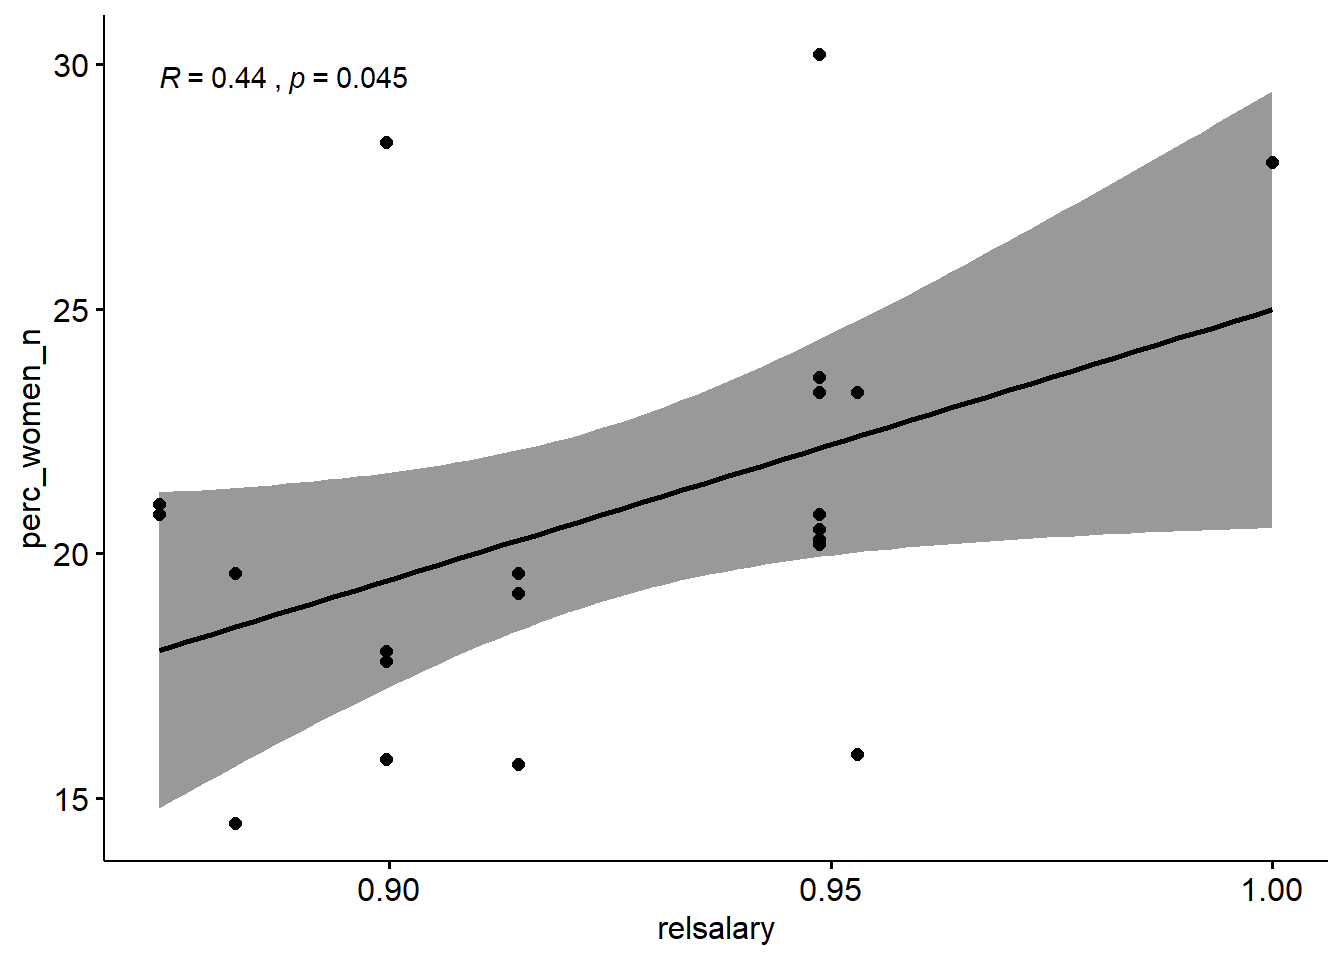
Figure 9.2: The correlation between the proportion of engineers who are women and the salaries of engineers in the region.
9.2 Number of men and women in SSYK 214 and the percentage of women in SSYK 214 Year 2014 - 2018
Average basic salary, monthly salary and women´s salary as a percentage of men´s salary by sector, occupational group (SSYK 2012), sex and educational level (SUN). Year 2014 - 2018 Number of employees All sectors 214, Architects, engineers and related professionals
readfile("000000CV_3.csv") %>%
  group_by (year) %>%
  mutate (perc_women = as.numeric (sub ("%", "", perc_women (salary)))) %>%
  ggplot(aes(x = year2)) +
  geom_line(mapping = aes(y = salary, colour = sex)) +
  geom_line(mapping = aes(y = perc_women * 2000)) +
  scale_y_continuous(sec.axis = sec_axis(~ . * 0.0005, name = "Percent women [%]"))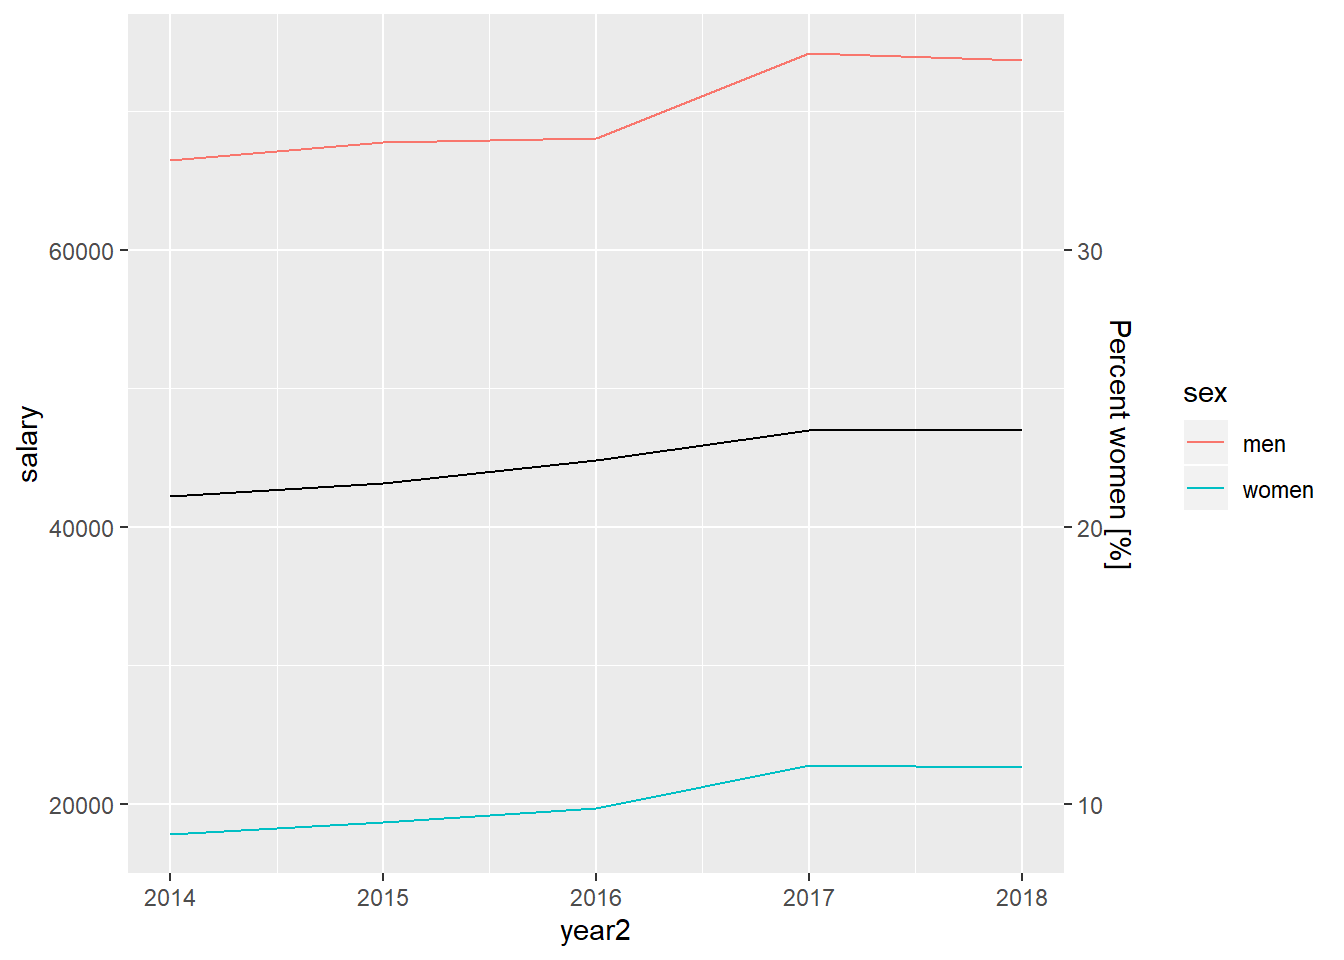
Figure 9.3: Number of men and women in SSYK 214 and the percentage of women in SSYK 214 Year 2014 - 2018
9.3 Number of men and women in SSYK 214 and the percentage of women in SSYK 214 Year 2003 - 2013
Average basic salary, monthly salary and women´s salary as a percentage of men´s salary by sector, occupational group (SSYK), sex and educational level (SUN). Year 2003 - 2013 Number of employees All sectors 214, Architects, engineers and related professionals
readfile("AM0110B4.csv") %>%
  group_by (year) %>%
  mutate (perc_women = as.numeric (sub ("%", "", perc_women (salary)))) %>%
  ggplot(aes(x = year2)) +
  geom_line(mapping = aes(y = salary, colour = sex)) +
  geom_line(mapping = aes(y = perc_women * 2000)) +
  scale_y_continuous(sec.axis = sec_axis(~ . * 0.0005, name = "Percent women [%]"))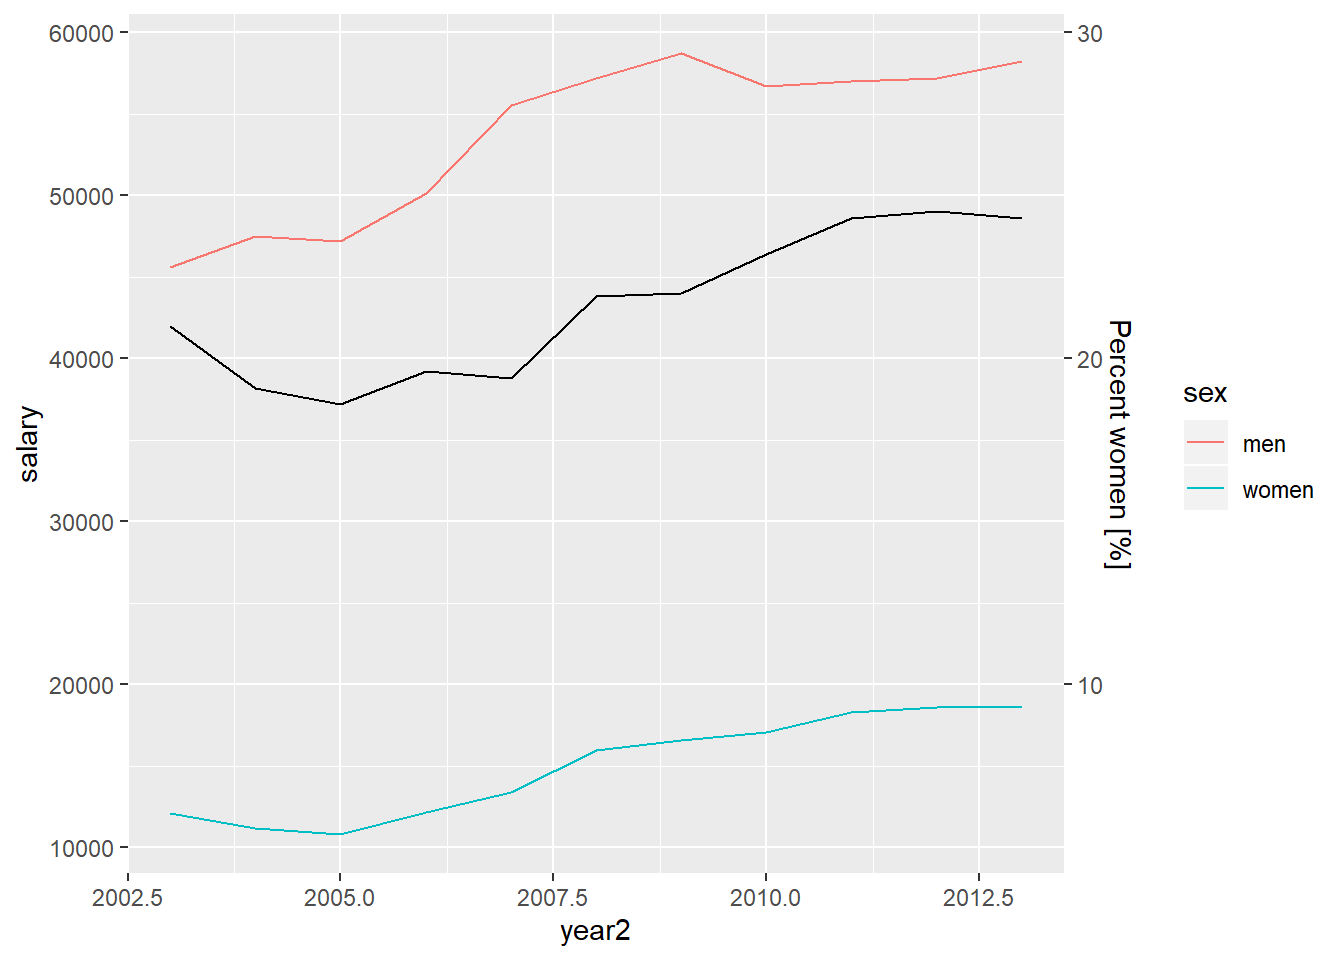
Figure 9.4: Number of men and women in SSYK 214 and the percentage of women in SSYK 214 Year 2003 - 2013
9.4 Age distribution in the different countys
Employees 16-64 years by region of work, occupation (3-digit SSYK 2012), age and sex. Year 2014 - 2017 occupation=214, Architects, engineers and related professionals
readfile("000000NK.csv") %>% filter(year2 == 2017) %>%
  rowwise() %>% mutate(age2 = unlist(lapply(strsplit(substr(age, 1, 5), "-"), strtoi))[1]) %>%
  rowwise() %>% mutate(age3 = unlist(lapply(strsplit(substr(age, 1, 5), "-"), strtoi))[2]) %>%
  ggplot() +
    geom_line(aes(x = (age2 + age3) / 2, y = salary, color = region)) +
    theme(legend.position="bottom") +
    facet_grid(. ~ sex)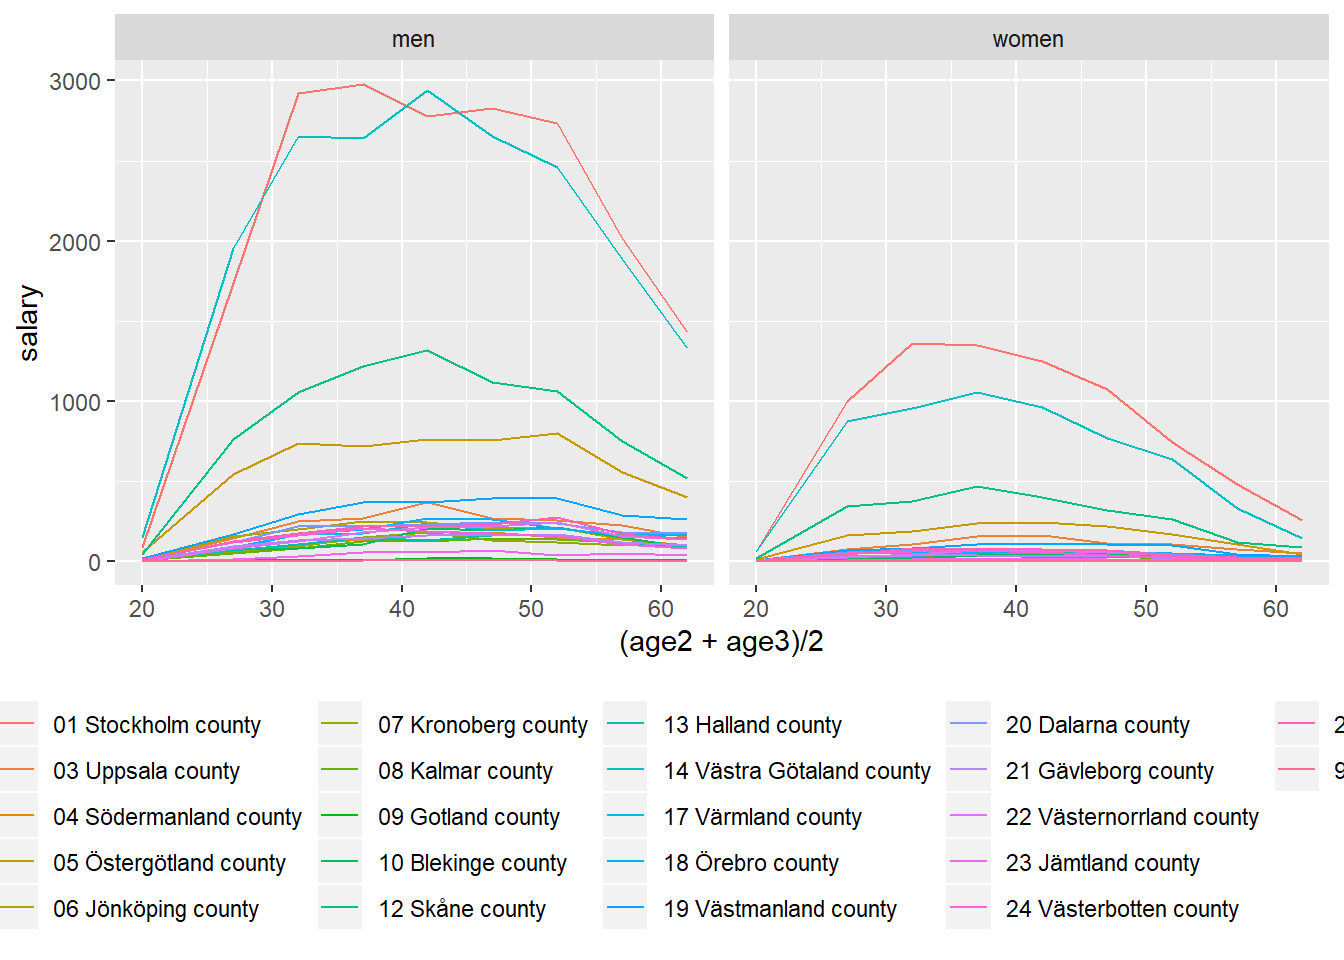
Figure 9.5: The age distribution in the different countys for engineers, year 2017
9.5 Sector distribution in the different countys
Employees 16-64 years by region of work, occupation (3-digit SSYK 2012), sector and sex. Year 2014 - 2017 occupation=214, Architects, engineers and related professionals
readfile("000000RM_1.csv") %>%
  filter(year2 == 2017) %>%
  mutate(lnkod_n = substr(region, 1,2))%>%
  ggplot(aes(x = lnkod_n, y = salary, fill = sector)) +
    geom_col(position = "fill") +
    theme(legend.position="bottom") +
    facet_grid(. ~ sex)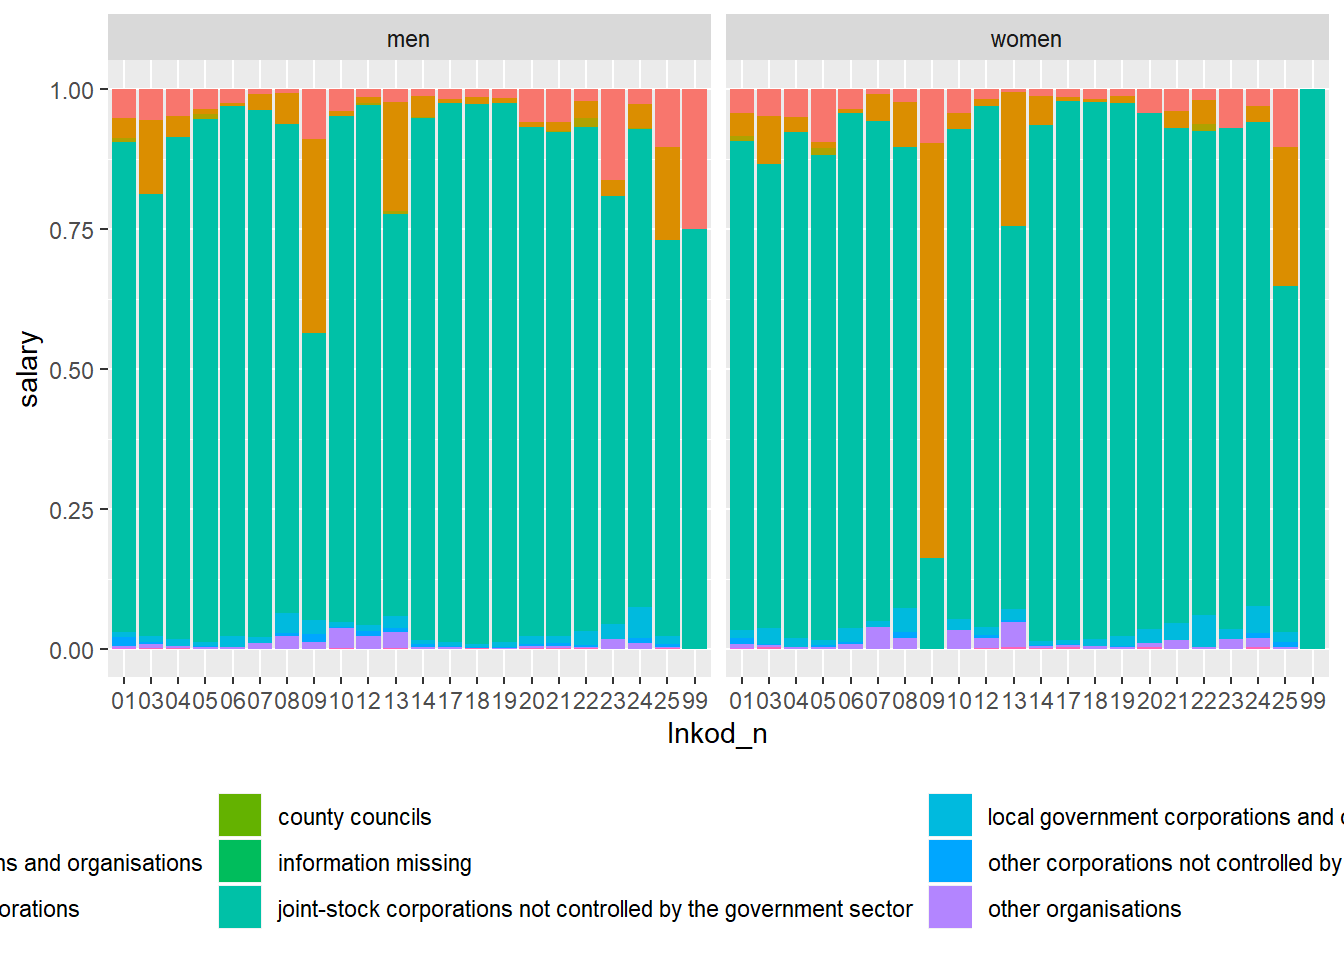
Figure 9.6: The sector distribution in the different countys for engineers, year 2017
9.6 Education distribution for engineers
Number of employees by sector, occuptional (SSYK 2012), sex, level of education and year 214 Engineering professionals All sectors Year 2017
edu <- readfile("000000CV_1.csv")
edu$`level of education` <- as.factor(edu$`level of education`)
edu$`level of education` <- factor(edu$`level of education`, levels(edu$`level of education`)[c(2, 3, 4, 6, 7, 5, 1)])
edu %>%
  filter(year2 == 2017) %>%
  ggplot(aes(x = `occuptional  (SSYK 2012)`, y = salary, fill = `level of education`)) +
    geom_col(position = "fill") +
    theme(legend.position="bottom") +
facet_grid(. ~ sex) 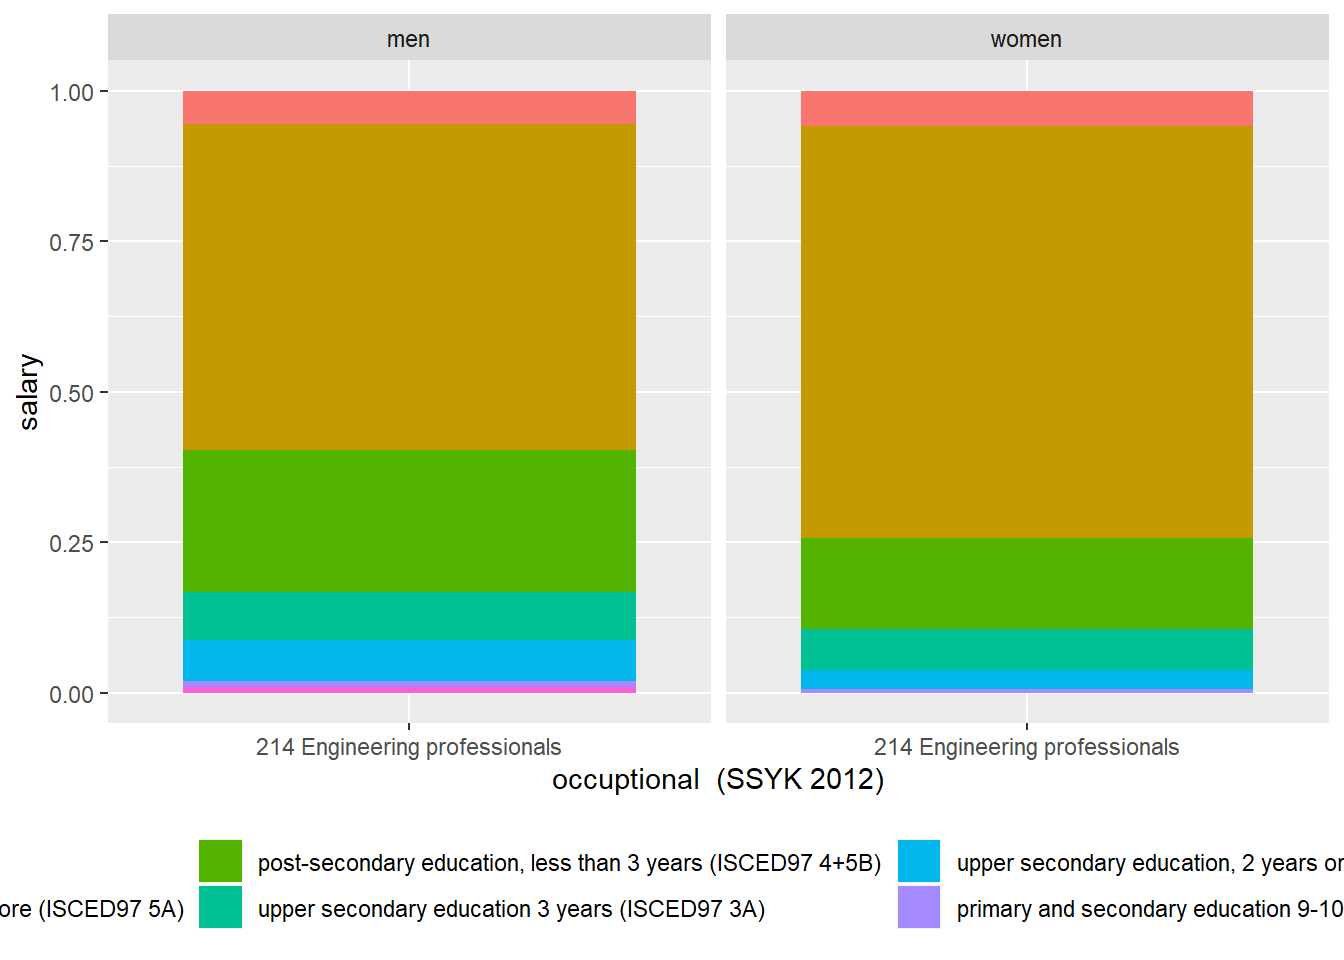
Figure 9.7: The education distribution for engineers, year 2017
9.7 Average monthly pay increase by occuption year 2000 - 2013
Average monthly pay (total pay), non-manual workers private sector (SLP), SEK by occuptional (SSYK 2012), age, sex and year, Year 2000 - 2013
age=total
sex=total
Average monthly pay (total pay), non-manual workers private sector (SLP), SEK by occuptional (SSYK 2012), age, sex and year, Year 2014 - 2018
age=total
sex=total
readfile ("AM0103E6.csv") %>%
  group_by (`occupational group (SSYK)`) %>%
  summarise (tot = tot_dev (salary)) %>%
  arrange (desc (tot)) %>%
  knitr::kable(
  booktabs = TRUE,
caption = 'Average monthly pay increase by occuption (SSYK 2012), Year 2000 - 2013') | occupational group (SSYK) | tot |
|---|---|
| 249 Psychologists, social work and related professionals | 71.1% |
| 723 Machinery mechanics and fitters | 70.4% |
| 822 Chemical-products machine operators | 66.8% |
| 829 Other machine operators and assemblers | 66.7% |
| 222 Health professionals (except nursing) | 66.6% |
| 0002 occupations unidentifiable | 63.1% |
| 722 Blacksmiths, tool-makers and related trades workers | 62.0% |
| 121 Directors and chief executives | 61.5% |
| 419 Other office clerks | 61.4% |
| 828 Assemblers | 61.1% |
| 731 Precision workers in metal and related materials | 60.8% |
| 815 Chemical-processing-plant operators | 60.7% |
| 522 Shop and stall salespersons and demonstrators | 60.5% |
| 131 Managers of small enterprises | 59.7% |
| 321 Agronomy and forestry technicians | 58.0% |
| 212 Mathematicians and statisticians | 57.6% |
| 221 Life science professionals | 57.3% |
| 919 Other sales and services elementary occupations | 56.9% |
| 324 Life science technicians | 56.7% |
| 413 Stores and transport clerks | 56.4% |
| 827 Food and related products machine operators | 55.7% |
| 331 Pre-primary education teaching associate professionals | 55.4% |
| 323 Nursing associate professionals | 54.9% |
| 246 Religious professionals | 54.4% |
| 341 Finance and sales associate professionals | 54.3% |
| 311 Physical and engineering science technicians | 54.2% |
| 512 Housekeeping and restaurant services workers | 54.2% |
| 347 Artistic, entertainment and sports associate professionals | 54.1% |
| 122 Production and operations managers | 52.9% |
| 348 Religious associate professionals | 52.4% |
| 713 Building finishers and related trades workers | 51.3% |
| 0000 All | 51.2% |
| 123 Other specialist managers | 51.2% |
| 914 Doorkeepers, newspaper and package deliverers and related workers | 50.9% |
| 315 Safety and quality inspectors | 50.8% |
| 412 Numerical clerks | 50.8% |
| 724 Electrical and electronic equipment mechanics and fitters | 50.7% |
| 346 Social work associate professionals | 50.3% |
| 342 Business services agents and trade brokers | 50.2% |
| 343 Administrative associate professionals | 50.2% |
| 825 Printing-, binding- and paper-products machine operators | 50.0% |
| 312 Computer associate professionals | 48.5% |
| 243 Archivists, librarians and related information professionals | 48.2% |
| 912 Helpers and cleaners | 47.7% |
| 422 Client information clerks | 47.6% |
| 513 Personal care and related workers | 47.3% |
| 913 Helpers in restaurants | 47.0% |
| 831 Locomotive-engine drivers and related worker | 46.9% |
| 712 Building frame and related trades workers | 46.8% |
| 816 Power-production and related plant operators | 45.2% |
| 411 Office secretaries and data entry operators | 44.4% |
| 112 Senior officials of special-interest organisations | 43.9% |
| 241 Business professionals | 43.0% |
| 514 Other personal services workers | 42.7% |
| 344 Customs, tax and related government associate professionals | 42.0% |
| 231 College, university and higher education teaching professionals | 41.8% |
| 211 Physicists, chemists and related professionals | 41.6% |
| 245 Writers and creative or performing artists | 40.7% |
| 832 Motor-vehicle drivers | 40.6% |
| 214 Architects, engineers and related professionals | 40.3% |
| 721 Metal moulders, welders, sheet-metal workers, structural-metal preparers and related trades workers | 39.9% |
| 322 Health associate professionals (except nursing) | 39.3% |
| 223 Nursing and midwifery professionals | 39.2% |
| 313 Optical and electronic equipment operators | 38.9% |
| 515 Protective services workers | 38.7% |
| 821 Metal- and mineral-products machine operators | 38.6% |
| 332 Other teaching associate professionals | 37.1% |
| 233 Primary education teaching professionals | 36.2% |
| 743 Garment and related trades workers | 35.8% |
| 242 Legal professionals | 35.7% |
| 421 Cashiers, tellers and related clerks | 35.7% |
| 833 Agricultural and other mobile-plant operators | 35.5% |
| 213 Computing professionals | 35.4% |
| 234 Special education teaching professionals | 34.6% |
| 235 Other teaching professionals | 34.5% |
| 511 Travel attendants and related workers | 34.3% |
| 933 Transport labourers and freight handlers | 34.0% |
| 248 Administrative professionals of special-interest organisations | 33.7% |
| 244 Social science and linguistics professionals (except social work professionals) | 33.0% |
| 232 Secondary education teaching professionals | 32.1% |
| 414 Library and filing clerks | 31.2% |
| 314 Ship and aircraft controllers and technicians | 29.5% |
| 915 Garbage collectors and related labourers | 27.9% |
| 611 Market gardeners and crop growers | 27.1% |
| 814 Wood-processing- and papermaking-plant operators | 26.6% |
| 932 Manufacturing labourers | 25.4% |
| 824 Wood-products machine operators | 23.9% |
| 714 Painters, building structure cleaners and related trades workers | 22.7% |
| 734 Craft printing and related trades workers | 22.5% |
| 612 Animal producers and related workers | 21.1% |
| 823 Rubber- and plastic-products machine operators | 15.7% |
| 247 Public service administrative professionals | 15.1% |
| 415 Mail carriers and sorting clerks | 13.6% |
| 124 Foreman | 13.1% |
| 111 Legislators and senior government officials | 0% |
| 834 Ships´ deck crews and related workers | 0% |
| 931 Mining and construction labourers | 0% |
| 812 Metal-processing-plant operators | -6.58% |
readfile ("00000031.csv") %>%
  group_by (`occuptional  (SSYK 2012)`) %>%
  summarise (tot = parse_number (tot_dev (salary))) %>%
  arrange (desc (tot)) %>%
  knitr::kable(
  booktabs = TRUE,
caption = 'Average monthly pay increase by occuption (SSYK 2012), Year 2014 - 2018') | occuptional (SSYK 2012) | tot |
|---|---|
| 222 Nursing professionals | 27.600 |
| 149 Education managers not elsewhere classified | 26.400 |
| 343 Photographers, interior decorators and entertainers | 24.800 |
| 443 Elected representatives | 19.500 |
| 334 Administrative and specialized secretaries | 19.200 |
| 266 Social work and counselling professionals | 18.400 |
| 171 Hotel and conference managers | 18.300 |
| 161 Financial and insurance managers | 18.100 |
| 173 Retail and wholesale trade managers | 17.800 |
| 121 Finance managers | 17.700 |
| 223 Nursing professionals (cont.) | 17.700 |
| 122 Human resource managers | 17.600 |
| 138 Forestry and agricultural production managers | 17.300 |
| 132 Supply, logistics and transport managers | 17.200 |
| 141 Primary and secondary schools and adult education managers | 16.700 |
| 142 Preschool managers | 16.000 |
| 152 Managers in social and curative care | 15.600 |
| 234 Primary- and pre-school teachers | 15.200 |
| 136 Production managers in construction and mining | 15.000 |
| 344 Driving instructors and other instructors | 14.800 |
| 123 Administration and planning managers | 14.400 |
| 153 Elderly care managers | 14.100 |
| 174 Sports, leisure and wellness managers | 14.100 |
| 267 Religious professionals and deacons | 14.100 |
| 265 Creative and performing artists | 13.600 |
| 179 Other services managers not elsewhere classified | 13.400 |
| 228 Specialists in health care not elsewhere classified | 13.400 |
| 312 Construction and manufacturing supervisors | 13.400 |
| 131 Information and communications technology service managers | 13.200 |
| 321 Medical and pharmaceutical technicians | 12.300 |
| 335 Tax and related government associate professionals | 12.300 |
| 134 Architectural and engineering managers | 12.200 |
| 217 Designers | 12.200 |
| 151 Health care managers | 11.800 |
| 311 Physical and engineering science technicians | 11.700 |
| 224 Psychologists and psychotherapists | 10.900 |
| 262 Museum curators and librarians and related professionals | 10.600 |
| 125 Sales and marketing managers | 10.400 |
| 233 Secondary education teachers | 10.300 |
| 159 Other social services managers | 10.200 |
| 332 Insurance advisers, sales and purchasing agents | 9.870 |
| 218 Specialists within environmental and health protection | 9.800 |
| 212 Mathematicians, actuaries and statisticians | 9.740 |
| 324 Veterinary assistants | 9.490 |
| 0000 All | 9.440 |
| 524 Event seller and telemarketers | 9.440 |
| 241 Accountants, financial analysts and fund managers | 9.430 |
| 411 Office assistants and other secretaries | 9.190 |
| 341 Social work and religious associate professionals | 9.030 |
| 226 Dentists | 8.980 |
| 231 University and higher education teachers | 8.920 |
| 345 Culinary associate professionals | 8.700 |
| 331 Financial and accounting associate professionals | 8.610 |
| 251 ICT architects, systems analysts and test managers | 8.310 |
| 124 Information, communication and public relations managers | 8.280 |
| 261 Legal professionals | 8.190 |
| 325 Dental hygienists | 8.160 |
| 213 Biologists, pharmacologists and specialists in agriculture and forestry | 8.140 |
| 232 Vocational education teachers | 7.740 |
| 242 Organisation analysts, policy administrators and human resource specialists | 7.590 |
| 137 Production managers in manufacturing | 7.540 |
| 154 Managers and leaders within religious bodies | 7.390 |
| 214 Engineering professionals | 7.240 |
| 211 Physicists and chemists | 6.820 |
| 422 Client information clerks | 6.430 |
| 421 Croupiers, debt collectors and related workers | 6.010 |
| 112 Managing directors and chief executives | 5.840 |
| 133 Research and development managers | 5.320 |
| 135 Real estate and head of administration manager | 5.170 |
| 333 Business services agents | 5.100 |
| 352 Broadcasting and audio-visual technicians | 4.790 |
| 129 Administration and service managers not elsewhere classified | 4.100 |
| 243 Marketing and public relations professionals | 4.070 |
| 351 ICT operations and user support technicians | 3.630 |
| 227 Naprapaths, physiotherapists, occupational therapists | 3.230 |
| 315 Ship and aircraft controllers and technicians | 3.190 |
| 264 Authors, journalists and linguists | 2.250 |
| 342 Athletes, fitness instructors and recreational workers | 2.110 |
| 216 Architects and surveyors | 2.080 |
| 172 Restaurant managers | 0.917 |
| 441 Library and filing clerks | -0.402 |
| 225 Veterinarians | -0.467 |
| 235 Teaching professionals not elsewhere classified | -2.720 |
| 0002 occupations unidentifiable | -4.510 |
| 111 Legislators and senior officials | -7.040 |
| 511 Cabin crew, guides and related workers | -7.610 |
| 221 Medical doctors | -8.990 |
9.8 SSYK 214, Architects, engineers and related professionals, Year 2000 - 2013
Average monthly pay, non-manual workers private sector (SLP) by occupational group (SSYK) age and sex. Year 2000 - 2013 Average monthly pay (total pay), non-manual workers private sector (SLP), SEK by occupational group (SSYK), age, sex and year
tb <- readfile("AM0103A9_1.csv") %>%
  rowwise() %>%
  mutate(age2 = unlist(lapply(strsplit(substr(age, 1, 5), "-"), strtoi))[1]) %>%
  rowwise() %>%
  mutate(age3 = unlist(lapply(strsplit(substr(age, 1, 5), "-"), strtoi))[2]) %>%
  mutate(age4 = (age3 + age2) / 2) %>%
  group_by (`occupational group (SSYK)`, age, sex) %>%
  mutate (grouprelsal = relative_dev (salary))
## Warning: Grouping rowwise data frame strips rowwise nature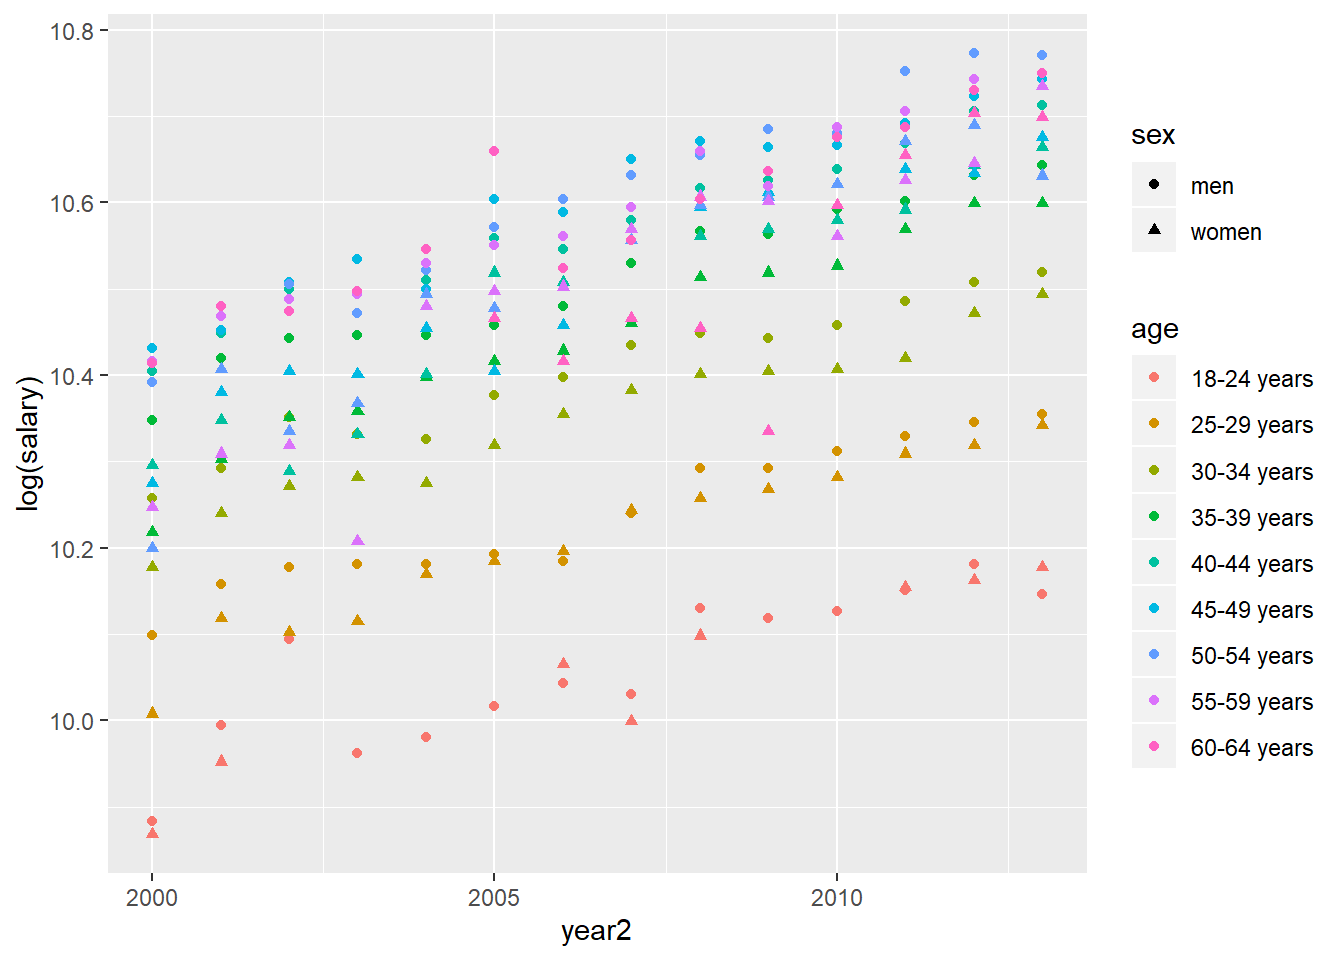
Figure 9.8: SSYK 214, Architects, engineers and related professionals, Year 2000 - 2013
tb <- bind_cols(tb, as_tibble(exp(predict(model, tb, interval = "confidence"))))

tb %>%
  ggplot () +
    geom_point (mapping = aes(x = year2,y = log(fit), colour = age, shape=sex))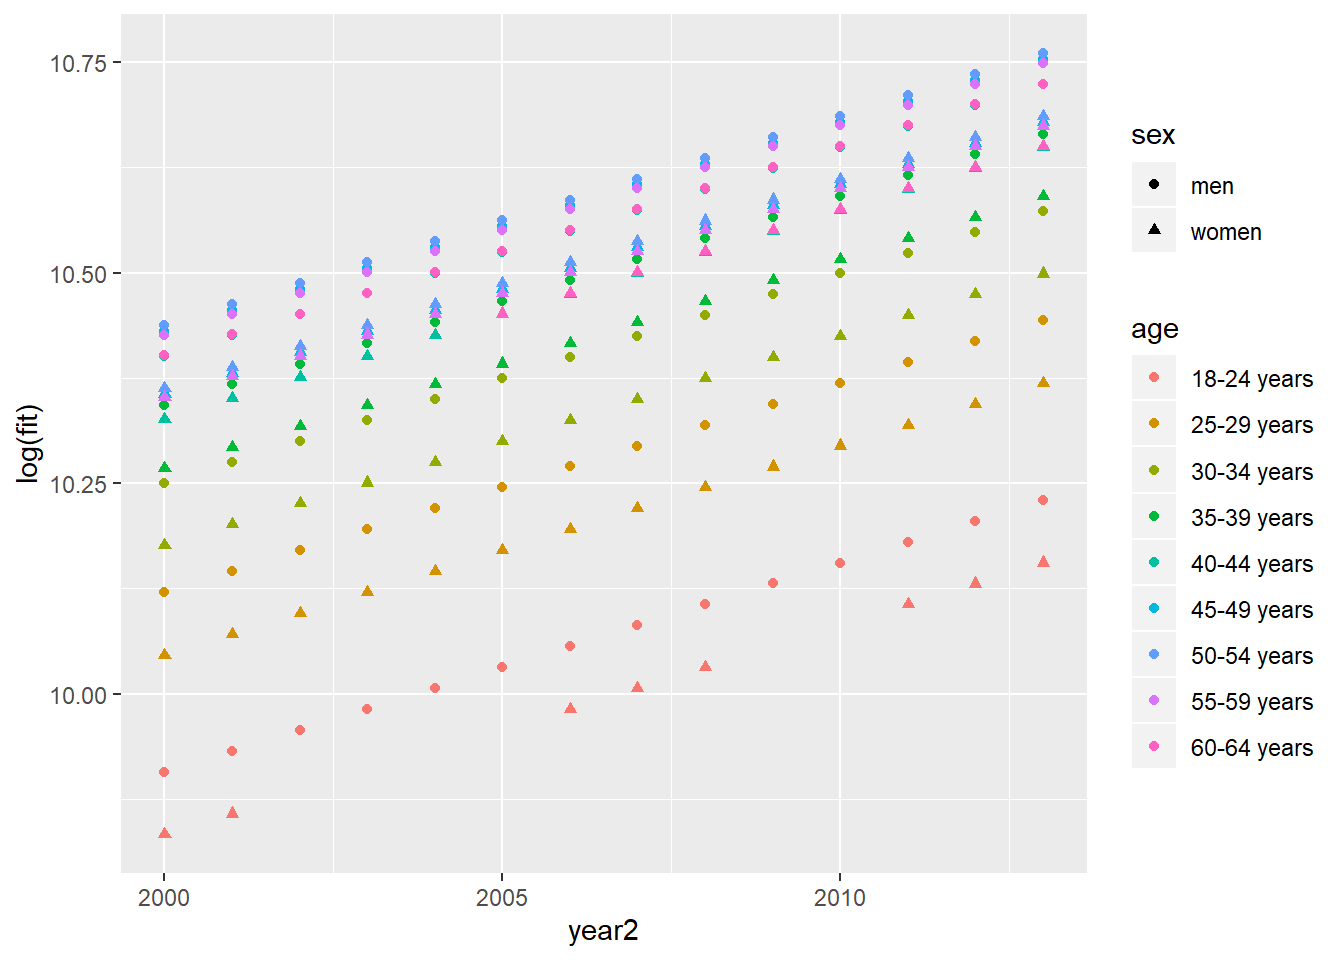
(#fig:ssyk00-13_2)SSYK, Year 2000 - 2013
summary(model) %>%
  tidy() %>%
  knitr::kable(
  booktabs = TRUE,
caption = 'Summary from linear model fit')| term | estimate | std.error | statistic | p.value |
|---|---|---|---|---|
| (Intercept) | -39.3602913 | 1.4040096 | -28.034204 | 0.0000000 |
| year2 | 0.0248351 | 0.0006997 | 35.492228 | 0.0000000 |
| sexwomen | -0.0745348 | 0.0056586 | -13.171933 | 0.0000000 |
| poly(age4, 3)1 | 2.1477927 | 0.0437199 | 49.126166 | 0.0000000 |
| poly(age4, 3)2 | -1.3140489 | 0.0439104 | -29.925667 | 0.0000000 |
| poly(age4, 3)3 | 0.1728549 | 0.0437183 | 3.953832 | 0.0001018 |
Anova(model, type=2) %>%
  tidy() %>%
  knitr::kable(
  booktabs = TRUE,
caption = 'Anova report from linear model fit') | term | sumsq | df | statistic | p.value |
|---|---|---|---|---|
| year2 | 2.4060060 | 1 | 1259.6982 | 0 |
| sex | 0.3313822 | 1 | 173.4998 | 0 |
| poly(age4, 3) | 6.3536207 | 3 | 1108.8424 | 0 |
| Residuals | 0.4488467 | 235 | NA | NA |
tb <- readfile("AM0103A9_2.csv") %>%
  rowwise() %>%
  mutate(age2 = unlist(lapply(strsplit(substr(age, 1, 5), "-"), strtoi))[1]) %>%
  rowwise() %>%
  mutate(age3 = unlist(lapply(strsplit(substr(age, 1, 5), "-"), strtoi))[2]) %>%
  mutate(age4 = (age3 + age2) / 2) %>%
  group_by (`occupational group (SSYK)`, age, sex) %>%
  mutate (grouprelsal = relative_dev (salary))
## Warning: Grouping rowwise data frame strips rowwise naturemodel <- lm (log(salary) ~ `occupational group (SSYK)` + year2 + sex + poly(age4, 3), data = tb)
summary(model) %>%
tidy() %>%
knitr::kable(
booktabs = TRUE,
caption = 'Summary from linear model fit')| term | estimate | std.error | statistic | p.value |
|---|---|---|---|---|
| (Intercept) | -48.9181797 | 0.4450215 | -109.9231939 | 0.0000000 |
occupational group (SSYK)121 Directors and chief executives |
0.6843097 | 0.0097694 | 70.0459713 | 0.0000000 |
occupational group (SSYK)122 Production and operations managers |
0.1497668 | 0.0077836 | 19.2414263 | 0.0000000 |
occupational group (SSYK)123 Other specialist managers |
0.3561121 | 0.0078044 | 45.6299353 | 0.0000000 |
occupational group (SSYK)124 Foreman |
-0.0781592 | 0.0118826 | -6.5776448 | 0.0000000 |
occupational group (SSYK)131 Managers of small enterprises |
-0.0251403 | 0.0078604 | -3.1983603 | 0.0013867 |
occupational group (SSYK)211 Physicists, chemists and related professionals |
0.2084204 | 0.0081189 | 25.6711740 | 0.0000000 |
occupational group (SSYK)212 Mathematicians and statisticians |
0.2004032 | 0.0348837 | 5.7448944 | 0.0000000 |
occupational group (SSYK)213 Computing professionals |
0.1512162 | 0.0076259 | 19.8291953 | 0.0000000 |
occupational group (SSYK)214 Architects, engineers and related professionals |
0.1216738 | 0.0076417 | 15.9223550 | 0.0000000 |
occupational group (SSYK)221 Life science professionals |
0.1249274 | 0.0129063 | 9.6795668 | 0.0000000 |
occupational group (SSYK)222 Health professionals (except nursing) |
0.3540252 | 0.0081056 | 43.6768676 | 0.0000000 |
occupational group (SSYK)223 Nursing and midwifery professionals |
-0.0537161 | 0.0096257 | -5.5804691 | 0.0000000 |
occupational group (SSYK)231 College, university and higher education teaching professionals |
0.0520675 | 0.0103711 | 5.0204408 | 0.0000005 |
occupational group (SSYK)232 Secondary education teaching professionals |
-0.2092601 | 0.0081292 | -25.7418084 | 0.0000000 |
occupational group (SSYK)233 Primary education teaching professionals |
-0.2351593 | 0.0091908 | -25.5864570 | 0.0000000 |
occupational group (SSYK)235 Other teaching professionals |
-0.1512582 | 0.0088117 | -17.1655476 | 0.0000000 |
occupational group (SSYK)241 Business professionals |
0.1536239 | 0.0075793 | 20.2689603 | 0.0000000 |
occupational group (SSYK)242 Legal professionals |
0.3756703 | 0.0087341 | 43.0119789 | 0.0000000 |
occupational group (SSYK)244 Social science and linguistics professionals (except social work professionals) |
-0.0037496 | 0.0845070 | -0.0443704 | 0.9646101 |
occupational group (SSYK)245 Writers and creative or performing artists |
-0.0242627 | 0.0075641 | -3.2076131 | 0.0013429 |
occupational group (SSYK)246 Religious professionals |
-0.0330001 | 0.0081970 | -4.0258803 | 0.0000572 |
occupational group (SSYK)247 Public service administrative professionals |
-0.0042949 | 0.0490043 | -0.0876426 | 0.9301626 |
occupational group (SSYK)248 Administrative professionals of special-interest organisations |
-0.0107107 | 0.0080066 | -1.3377348 | 0.1810151 |
occupational group (SSYK)249 Psychologists, social work and related professionals |
-0.1350674 | 0.0102828 | -13.1353089 | 0.0000000 |
occupational group (SSYK)311 Physical and engineering science technicians |
-0.0704933 | 0.0075566 | -9.3286738 | 0.0000000 |
occupational group (SSYK)312 Computer associate professionals |
-0.0709126 | 0.0076020 | -9.3281629 | 0.0000000 |
occupational group (SSYK)313 Optical and electronic equipment operators |
-0.2000192 | 0.0095361 | -20.9750036 | 0.0000000 |
occupational group (SSYK)314 Ship and aircraft controllers and technicians |
0.3906773 | 0.0102647 | 38.0601753 | 0.0000000 |
occupational group (SSYK)315 Safety and quality inspectors |
-0.1200257 | 0.0091762 | -13.0800884 | 0.0000000 |
occupational group (SSYK)321 Agronomy and forestry technicians |
-0.1451979 | 0.0136048 | -10.6725322 | 0.0000000 |
occupational group (SSYK)322 Health associate professionals (except nursing) |
-0.1388401 | 0.0088585 | -15.6730682 | 0.0000000 |
occupational group (SSYK)323 Nursing associate professionals |
-0.0797149 | 0.0090905 | -8.7690673 | 0.0000000 |
occupational group (SSYK)324 Life science technicians |
-0.2069808 | 0.0110118 | -18.7962311 | 0.0000000 |
occupational group (SSYK)331 Pre-primary education teaching associate professionals |
-0.3033610 | 0.0099170 | -30.5901460 | 0.0000000 |
occupational group (SSYK)332 Other teaching associate professionals |
-0.2774992 | 0.0128234 | -21.6400468 | 0.0000000 |
occupational group (SSYK)341 Finance and sales associate professionals |
-0.0239146 | 0.0075566 | -3.1647205 | 0.0015572 |
occupational group (SSYK)342 Business services agents and trade brokers |
-0.1491105 | 0.0078277 | -19.0490038 | 0.0000000 |
occupational group (SSYK)343 Administrative associate professionals |
-0.1074541 | 0.0075641 | -14.2058125 | 0.0000000 |
occupational group (SSYK)346 Social work associate professionals |
-0.3102289 | 0.0080925 | -38.3352361 | 0.0000000 |
occupational group (SSYK)347 Artistic, entertainment and sports associate professionals |
-0.1286704 | 0.0083758 | -15.3621676 | 0.0000000 |
occupational group (SSYK)411 Office secretaries and data entry operators |
-0.2446566 | 0.0085685 | -28.5531838 | 0.0000000 |
occupational group (SSYK)412 Numerical clerks |
-0.2419657 | 0.0075791 | -31.9252462 | 0.0000000 |
occupational group (SSYK)413 Stores and transport clerks |
-0.2638604 | 0.0075790 | -34.8145586 | 0.0000000 |
occupational group (SSYK)415 Mail carriers and sorting clerks |
-0.4045545 | 0.0097712 | -41.4026300 | 0.0000000 |
occupational group (SSYK)419 Other office clerks |
-0.2812810 | 0.0075640 | -37.1865647 | 0.0000000 |
occupational group (SSYK)421 Cashiers, tellers and related clerks |
-0.2911851 | 0.0085149 | -34.1973054 | 0.0000000 |
occupational group (SSYK)422 Client information clerks |
-0.3466551 | 0.0076021 | -45.6000045 | 0.0000000 |
occupational group (SSYK)511 Travel attendants and related workers |
-0.1698378 | 0.0080115 | -21.1992587 | 0.0000000 |
occupational group (SSYK)512 Housekeeping and restaurant services workers |
-0.3675951 | 0.0112797 | -32.5890874 | 0.0000000 |
occupational group (SSYK)513 Personal care and related workers |
-0.3716465 | 0.0075867 | -48.9868159 | 0.0000000 |
occupational group (SSYK)514 Other personal services workers |
-0.3457294 | 0.0156694 | -22.0640010 | 0.0000000 |
occupational group (SSYK)515 Protective services workers |
-0.2028056 | 0.0120050 | -16.8934447 | 0.0000000 |
occupational group (SSYK)522 Shop and stall salespersons and demonstrators |
-0.2671818 | 0.0075790 | -35.2527597 | 0.0000000 |
occupational group (SSYK)712 Building frame and related trades workers |
-0.2663715 | 0.0166078 | -16.0389248 | 0.0000000 |
occupational group (SSYK)713 Building finishers and related trades workers |
-0.2953711 | 0.0112955 | -26.1493579 | 0.0000000 |
occupational group (SSYK)723 Machinery mechanics and fitters |
-0.2832357 | 0.0105255 | -26.9095171 | 0.0000000 |
occupational group (SSYK)724 Electrical and electronic equipment mechanics and fitters |
-0.2433953 | 0.0093842 | -25.9367630 | 0.0000000 |
occupational group (SSYK)734 Craft printing and related trades workers |
-0.2137465 | 0.0180896 | -11.8159893 | 0.0000000 |
occupational group (SSYK)815 Chemical-processing-plant operators |
-0.1040442 | 0.0425224 | -2.4468097 | 0.0144308 |
occupational group (SSYK)816 Power-production and related plant operators |
-0.2126282 | 0.0113508 | -18.7323998 | 0.0000000 |
occupational group (SSYK)825 Printing-, binding- and paper-products machine operators |
-0.1779737 | 0.0240425 | -7.4024477 | 0.0000000 |
occupational group (SSYK)828 Assemblers |
-0.2745193 | 0.0211832 | -12.9592743 | 0.0000000 |
occupational group (SSYK)829 Other machine operators and assemblers |
-0.1861654 | 0.0224749 | -8.2832519 | 0.0000000 |
occupational group (SSYK)831 Locomotive-engine drivers and related worker |
-0.1837192 | 0.0102368 | -17.9469107 | 0.0000000 |
occupational group (SSYK)832 Motor-vehicle drivers |
-0.4036730 | 0.0092552 | -43.6156159 | 0.0000000 |
occupational group (SSYK)912 Helpers and cleaners |
-0.4112420 | 0.0095967 | -42.8526533 | 0.0000000 |
occupational group (SSYK)913 Helpers in restaurants |
-0.4004462 | 0.0272415 | -14.6998478 | 0.0000000 |
occupational group (SSYK)914 Doorkeepers, newspaper and package deliverers and related workers |
-0.4233767 | 0.0112253 | -37.7163717 | 0.0000000 |
occupational group (SSYK)919 Other sales and services elementary occupations |
-0.4459274 | 0.0147337 | -30.2659045 | 0.0000000 |
occupational group (SSYK)933 Transport labourers and freight handlers |
-0.2855748 | 0.0845382 | -3.3780563 | 0.0007330 |
| year2 | 0.0295469 | 0.0002218 | 133.2286965 | 0.0000000 |
| sexwomen | -0.0940155 | 0.0019313 | -48.6800444 | 0.0000000 |
| poly(age4, 3)1 | 8.0085927 | 0.0860976 | 93.0176060 | 0.0000000 |
| poly(age4, 3)2 | -5.4012785 | 0.0860881 | -62.7413239 | 0.0000000 |
| poly(age4, 3)3 | 0.6344314 | 0.0849507 | 7.4682340 | 0.0000000 |
Anova(model, type=2) %>%
  tidy() %>%
  knitr::kable(
  booktabs = TRUE,
caption = 'Anova report from linear model fit')| term | sumsq | df | statistic | p.value |
|---|---|---|---|---|
occupational group (SSYK) |
453.90944 | 70 | 912.2726 | 0 |
| year2 | 126.16594 | 1 | 17749.8856 | 0 |
| sex | 16.84413 | 1 | 2369.7467 | 0 |
| poly(age4, 3) | 88.63996 | 3 | 4156.8249 | 0 |
| Residuals | 67.14914 | 9447 | NA | NA |
9.9 SSYK 214, Architects, engineers and related professionals, Year 2014 - 2018
Average monthly pay, non-manual workers private sector (SLP) by occupational group (SSYK 2012) age and sex. Year 2014 - 2018 Average monthly pay (total pay), non-manual workers private sector (SLP), SEK by occupational group (SSYK), age, sex and year
tb <- readfile("00000031_1.csv") %>%
  rowwise() %>%
  mutate(age2 = unlist(lapply(strsplit(substr(age, 1, 5), "-"), strtoi))[1]) %>%
  rowwise() %>%
  mutate(age3 = unlist(lapply(strsplit(substr(age, 1, 5), "-"), strtoi))[2]) %>%
  mutate(age4 = (age3 + age2) / 2) %>%
  group_by (`occuptional  (SSYK 2012)`, age, sex) %>%
  mutate (grouprelsal = relative_dev (salary))
## Warning: Grouping rowwise data frame strips rowwise nature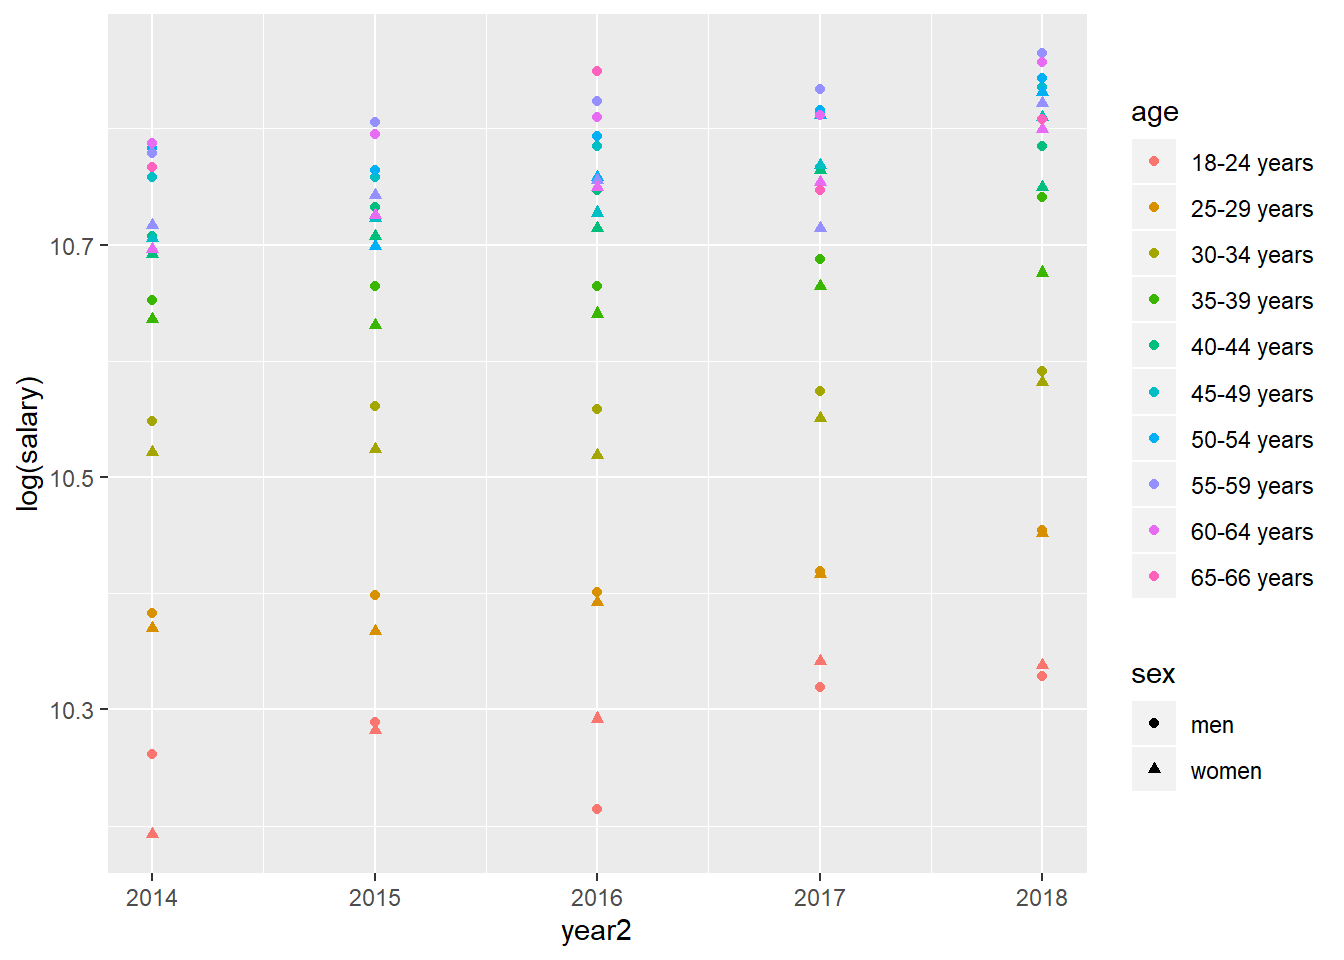
Figure 9.9: SSYK 214, Architects, engineers and related professionals, Year 2014 - 2018
model <- lm (log(salary) ~ year2 + sex + poly(age4, 3), data = tb)

tb <- bind_cols(tb, as_tibble(exp(predict(model, tb, interval = "confidence"))))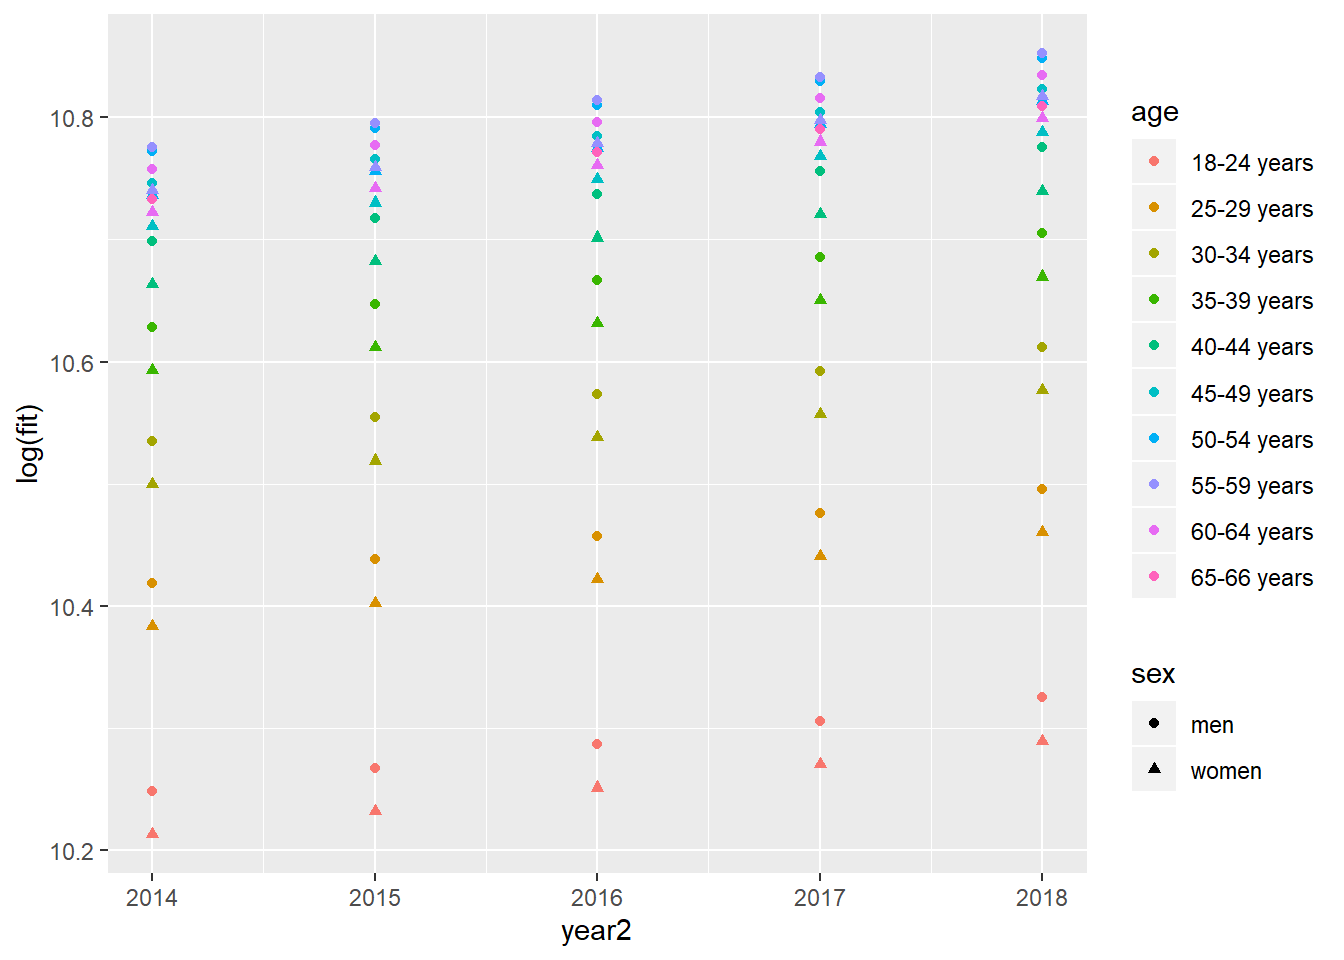
(#fig:ssyk14-18_2)Model fit, SSYK 214, Architects, engineers and related professionals, Year 2014 - 2018
summary(model) %>%
  tidy() %>%
  knitr::kable(
  booktabs = TRUE,
caption = 'Summary from linear model fit')| term | estimate | std.error | statistic | p.value |
|---|---|---|---|---|
| (Intercept) | -27.9987545 | 4.1947424 | -6.674726 | 0.0000000 |
| year2 | 0.0191776 | 0.0020807 | 9.216871 | 0.0000000 |
| sexwomen | -0.0353468 | 0.0059660 | -5.924684 | 0.0000001 |
| poly(age4, 3)1 | 1.5018782 | 0.0286694 | 52.386134 | 0.0000000 |
| poly(age4, 3)2 | -0.7321485 | 0.0287026 | -25.508120 | 0.0000000 |
| poly(age4, 3)3 | 0.0082994 | 0.0287225 | 0.288952 | 0.7732977 |
Anova(model, type=2) %>%
  tidy() %>%
  knitr::kable(
  booktabs = TRUE,
caption = 'Anova report from linear model fit')| term | sumsq | df | statistic | p.value |
|---|---|---|---|---|
| year2 | 0.0694613 | 1 | 84.95072 | 0e+00 |
| sex | 0.0287016 | 1 | 35.10188 | 1e-07 |
| poly(age4, 3) | 2.7897056 | 3 | 1137.26462 | 0e+00 |
| Residuals | 0.0719545 | 88 | NA | NA |
tb <- readfile("00000031_3.csv") %>%
  rowwise() %>%
  mutate(age2 = unlist(lapply(strsplit(substr(age, 1, 5), "-"), strtoi))[1]) %>%
  rowwise() %>%
  mutate(age3 = unlist(lapply(strsplit(substr(age, 1, 5), "-"), strtoi))[2]) %>%
  mutate(age4 = (age3 + age2) / 2) %>%
  group_by (`occuptional  (SSYK 2012)`, age, sex) %>%
  mutate (grouprelsal = relative_dev (salary))
## Warning: Grouping rowwise data frame strips rowwise naturemodel <- lm (log(salary) ~ `occuptional (SSYK 2012)` + year2 + sex + poly(age4, 3), data = tb)
summary(model) %>%
tidy() %>%
knitr::kable(
booktabs = TRUE,
caption = 'Summary from linear model fit')| term | estimate | std.error | statistic | p.value |
|---|---|---|---|---|
| (Intercept) | -37.5468927 | 2.0470713 | -18.3417615 | 0.0000000 |
occuptional (SSYK 2012)112 Managing directors and chief executives |
0.6170543 | 0.0192423 | 32.0676708 | 0.0000000 |
occuptional (SSYK 2012)121 Finance managers |
0.4769831 | 0.0156019 | 30.5721499 | 0.0000000 |
occuptional (SSYK 2012)122 Human resource managers |
0.4542501 | 0.0164617 | 27.5943225 | 0.0000000 |
occuptional (SSYK 2012)123 Administration and planning managers |
0.4956227 | 0.0167515 | 29.5867070 | 0.0000000 |
occuptional (SSYK 2012)124 Information, communication and public relations managers |
0.5278895 | 0.0246679 | 21.3998755 | 0.0000000 |
occuptional (SSYK 2012)125 Sales and marketing managers |
0.3861924 | 0.0148564 | 25.9950674 | 0.0000000 |
occuptional (SSYK 2012)129 Administration and service managers not elsewhere classified |
0.2823372 | 0.0148218 | 19.0488006 | 0.0000000 |
occuptional (SSYK 2012)131 Information and communications technology service managers |
0.4022867 | 0.0158027 | 25.4568486 | 0.0000000 |
occuptional (SSYK 2012)132 Supply, logistics and transport managers |
0.2973659 | 0.0166430 | 17.8673640 | 0.0000000 |
occuptional (SSYK 2012)133 Research and development managers |
0.5276822 | 0.0161981 | 32.5768948 | 0.0000000 |
occuptional (SSYK 2012)134 Architectural and engineering managers |
0.3935430 | 0.0161977 | 24.2961723 | 0.0000000 |
occuptional (SSYK 2012)135 Real estate and head of administration manager |
0.2313332 | 0.0277684 | 8.3308092 | 0.0000000 |
occuptional (SSYK 2012)136 Production managers in construction and mining |
0.2887767 | 0.0161857 | 17.8415086 | 0.0000000 |
occuptional (SSYK 2012)137 Production managers in manufacturing |
0.1975406 | 0.0161121 | 12.2604253 | 0.0000000 |
occuptional (SSYK 2012)141 Primary and secondary schools and adult education managers |
0.1834401 | 0.0890480 | 2.0600138 | 0.0394652 |
occuptional (SSYK 2012)151 Health care managers |
0.1681348 | 0.0188836 | 8.9037297 | 0.0000000 |
occuptional (SSYK 2012)154 Managers and leaders within religious bodies |
0.2966825 | 0.0456125 | 6.5044143 | 0.0000000 |
occuptional (SSYK 2012)159 Other social services managers |
0.2081647 | 0.0175764 | 11.8434133 | 0.0000000 |
occuptional (SSYK 2012)161 Financial and insurance managers |
0.7252319 | 0.0165534 | 43.8115622 | 0.0000000 |
occuptional (SSYK 2012)172 Restaurant managers |
-0.0518488 | 0.0230186 | -2.2524718 | 0.0243494 |
occuptional (SSYK 2012)173 Retail and wholesale trade managers |
0.1104125 | 0.0175625 | 6.2868269 | 0.0000000 |
occuptional (SSYK 2012)179 Other services managers not elsewhere classified |
0.0896892 | 0.0151243 | 5.9301557 | 0.0000000 |
occuptional (SSYK 2012)211 Physicists and chemists |
0.1497958 | 0.0157317 | 9.5218952 | 0.0000000 |
occuptional (SSYK 2012)212 Mathematicians, actuaries and statisticians |
0.1949668 | 0.0890529 | 2.1893368 | 0.0286330 |
occuptional (SSYK 2012)213 Biologists, pharmacologists and specialists in agriculture and forestry |
0.0421748 | 0.0159456 | 2.6449250 | 0.0082046 |
occuptional (SSYK 2012)214 Engineering professionals |
0.1572491 | 0.0141277 | 11.1305556 | 0.0000000 |
occuptional (SSYK 2012)216 Architects and surveyors |
0.0515622 | 0.0173139 | 2.9780763 | 0.0029190 |
occuptional (SSYK 2012)217 Designers |
-0.0081672 | 0.0154654 | -0.5280988 | 0.5974617 |
occuptional (SSYK 2012)218 Specialists within environmental and health protection |
0.0740458 | 0.0173017 | 4.2796822 | 0.0000192 |
occuptional (SSYK 2012)221 Medical doctors |
0.5403667 | 0.0166303 | 32.4928738 | 0.0000000 |
occuptional (SSYK 2012)222 Nursing professionals |
0.0609359 | 0.0146890 | 4.1484062 | 0.0000342 |
occuptional (SSYK 2012)223 Nursing professionals (cont.) |
-0.0375099 | 0.0185202 | -2.0253518 | 0.0429011 |
occuptional (SSYK 2012)224 Psychologists and psychotherapists |
0.1310728 | 0.0634630 | 2.0653411 | 0.0389585 |
occuptional (SSYK 2012)225 Veterinarians |
0.1451057 | 0.0246877 | 5.8776629 | 0.0000000 |
occuptional (SSYK 2012)226 Dentists |
0.2061785 | 0.0217913 | 9.4614837 | 0.0000000 |
occuptional (SSYK 2012)227 Naprapaths, physiotherapists, occupational therapists |
-0.1370381 | 0.0177376 | -7.7258431 | 0.0000000 |
occuptional (SSYK 2012)228 Specialists in health care not elsewhere classified |
0.0071140 | 0.0168624 | 0.4218871 | 0.6731313 |
occuptional (SSYK 2012)231 University and higher education teachers |
0.1367054 | 0.0160981 | 8.4920376 | 0.0000000 |
occuptional (SSYK 2012)232 Vocational education teachers |
-0.2934218 | 0.0634613 | -4.6236362 | 0.0000039 |
occuptional (SSYK 2012)233 Secondary education teachers |
-0.1041122 | 0.0351897 | -2.9586030 | 0.0031095 |
occuptional (SSYK 2012)234 Primary- and pre-school teachers |
-0.1872326 | 0.0143234 | -13.0717619 | 0.0000000 |
occuptional (SSYK 2012)235 Teaching professionals not elsewhere classified |
-0.1425854 | 0.0168496 | -8.4622613 | 0.0000000 |
occuptional (SSYK 2012)241 Accountants, financial analysts and fund managers |
0.2278752 | 0.0144328 | 15.7887542 | 0.0000000 |
occuptional (SSYK 2012)242 Organisation analysts, policy administrators and human resource specialists |
0.1696041 | 0.0142889 | 11.8696265 | 0.0000000 |
occuptional (SSYK 2012)243 Marketing and public relations professionals |
0.1407585 | 0.0144341 | 9.7518221 | 0.0000000 |
occuptional (SSYK 2012)251 ICT architects, systems analysts and test managers |
0.1672958 | 0.0140985 | 11.8662120 | 0.0000000 |
occuptional (SSYK 2012)261 Legal professionals |
0.3910677 | 0.0155923 | 25.0808377 | 0.0000000 |
occuptional (SSYK 2012)264 Authors, journalists and linguists |
-0.0018197 | 0.0142888 | -0.1273494 | 0.8986706 |
occuptional (SSYK 2012)265 Creative and performing artists |
-0.0880117 | 0.0149099 | -5.9029016 | 0.0000000 |
occuptional (SSYK 2012)266 Social work and counselling professionals |
-0.0295346 | 0.0205064 | -1.4402594 | 0.1498765 |
occuptional (SSYK 2012)267 Religious professionals and deacons |
-0.0405199 | 0.0173192 | -2.3395977 | 0.0193561 |
occuptional (SSYK 2012)311 Physical and engineering science technicians |
0.0168089 | 0.0141598 | 1.1870890 | 0.2352668 |
occuptional (SSYK 2012)312 Construction and manufacturing supervisors |
-0.0106277 | 0.0149022 | -0.7131646 | 0.4757877 |
occuptional (SSYK 2012)315 Ship and aircraft controllers and technicians |
0.2331542 | 0.0192622 | 12.1042123 | 0.0000000 |
occuptional (SSYK 2012)321 Medical and pharmaceutical technicians |
-0.0730238 | 0.0143600 | -5.0852059 | 0.0000004 |
occuptional (SSYK 2012)324 Veterinary assistants |
-0.1810371 | 0.0205006 | -8.8308107 | 0.0000000 |
occuptional (SSYK 2012)325 Dental hygienists |
-0.1573366 | 0.0177376 | -8.8702166 | 0.0000000 |
occuptional (SSYK 2012)331 Financial and accounting associate professionals |
0.0449942 | 0.0142214 | 3.1638300 | 0.0015694 |
occuptional (SSYK 2012)332 Insurance advisers, sales and purchasing agents |
0.0509263 | 0.0141278 | 3.6046962 | 0.0003165 |
occuptional (SSYK 2012)333 Business services agents |
-0.0320470 | 0.0145514 | -2.2023342 | 0.0277016 |
occuptional (SSYK 2012)334 Administrative and specialized secretaries |
-0.0007863 | 0.0147644 | -0.0532548 | 0.9575317 |
occuptional (SSYK 2012)335 Tax and related government associate professionals |
-0.0126953 | 0.0145522 | -0.8723958 | 0.3830477 |
occuptional (SSYK 2012)341 Social work and religious associate professionals |
-0.2183480 | 0.0166441 | -13.1186498 | 0.0000000 |
occuptional (SSYK 2012)342 Athletes, fitness instructors and recreational workers |
-0.1492056 | 0.0147206 | -10.1358383 | 0.0000000 |
occuptional (SSYK 2012)343 Photographers, interior decorators and entertainers |
-0.1203248 | 0.0162674 | -7.3966895 | 0.0000000 |
occuptional (SSYK 2012)344 Driving instructors and other instructors |
-0.2170414 | 0.0277391 | -7.8243728 | 0.0000000 |
occuptional (SSYK 2012)345 Culinary associate professionals |
-0.3831146 | 0.0278107 | -13.7757851 | 0.0000000 |
occuptional (SSYK 2012)351 ICT operations and user support technicians |
-0.0335916 | 0.0142884 | -2.3509619 | 0.0187758 |
occuptional (SSYK 2012)352 Broadcasting and audio-visual technicians |
-0.2179292 | 0.0190592 | -11.4343596 | 0.0000000 |
occuptional (SSYK 2012)411 Office assistants and other secretaries |
-0.1911902 | 0.0141285 | -13.5322664 | 0.0000000 |
occuptional (SSYK 2012)422 Client information clerks |
-0.2841125 | 0.0141584 | -20.0666661 | 0.0000000 |
occuptional (SSYK 2012)511 Cabin crew, guides and related workers |
-0.1823307 | 0.0183293 | -9.9474824 | 0.0000000 |
occuptional (SSYK 2012)524 Event seller and telemarketers |
-0.2089114 | 0.0195200 | -10.7024445 | 0.0000000 |
| year2 | 0.0238570 | 0.0010154 | 23.4955442 | 0.0000000 |
| sexwomen | -0.0767252 | 0.0030556 | -25.1096548 | 0.0000000 |
| poly(age4, 3)1 | 6.6940905 | 0.0918162 | 72.9074788 | 0.0000000 |
| poly(age4, 3)2 | -4.1563876 | 0.0920040 | -45.1761784 | 0.0000000 |
| poly(age4, 3)3 | 0.2201252 | 0.0896214 | 2.4561686 | 0.0140872 |
Anova(model, type=2) %>%
  tidy() %>%
  knitr::kable(
  booktabs = TRUE,
caption = 'Anova report from linear model fit') | term | sumsq | df | statistic | p.value |
|---|---|---|---|---|
occuptional (SSYK 2012) |
180.651642 | 73 | 317.1308 | 0 |
| year2 | 4.307761 | 1 | 552.0406 | 0 |
| sex | 4.919966 | 1 | 630.4948 | 0 |
| poly(age4, 3) | 56.139659 | 3 | 2398.1033 | 0 |
| Residuals | 29.629289 | 3797 | NA | NA |
9.12 The correlation between the proportion of engineers who are women and the salaries of engineers in the region. Year 2014 - 2018
Average basic salary, monthly salary and women´s salary as a percentage of men´s salary by region, sector, occupational group (SSYK 2012) and sex . Year 2014 - 2018 Monthly salaty All sectors 214 Engineering professionals
Average basic salary, monthly salary and women´s salary as a percentage of men´s salary by region, sector, occupational group (SSYK 2012) and sex . Year 2014 - 2018 Number of employees All sectors 214 Engineering professionals
tb <- readfile("000000CG_10.csv")
tb <- readfile("000000CD_10.csv") %>%
left_join(tb, by = c("region", "year", "sex")) %>%
group_by (`region`, year) %>%
mutate (perc_women = as.numeric (sub ("%", "", perc_women (salary.x))))
model <- lm (log(salary.y) ~ year2.x + perc_women, data = tb)
summary(model) %>%
tidy() %>%
knitr::kable(
booktabs = TRUE,
caption = 'The correlation between the proportion of engineers who are women and the salaries of engineers in the region.')| term | estimate | std.error | statistic | p.value |
|---|---|---|---|---|
| (Intercept) | -16.8472433 | 7.9797518 | -2.111249 | 0.0381752 |
| year2.x | 0.0135156 | 0.0039623 | 3.411042 | 0.0010580 |
| perc_women | 0.0120174 | 0.0018213 | 6.598323 | 0.0000000 |
Anova(model, type=2) %>%
  tidy() %>%
  knitr::kable(
  booktabs = TRUE,
caption = 'Anova report from linear model fit') | term | sumsq | df | statistic | p.value |
|---|---|---|---|---|
| year2.x | 0.0249689 | 1 | 11.63521 | 0.001058 |
| perc_women | 0.0934314 | 1 | 43.53787 | 0.000000 |
| Residuals | 0.1566566 | 73 | NA | NA |
9.13 The correlation between the proportion of engineers who are women and the salaries of engineers in the region. Year 2003 - 2013
Average basic salary, monthly salary and women´s salary as a percentage of men´s salary by region, sector, occupational group (SSYK 2012) and sex . Year 2003 - 2013 Number of employees All sectors 214 Engineering professionals
tb <- readfile("AM0110A2.csv")
tb <- readfile("AM0110A4.csv") %>%
left_join(tb, by = c("region", "year", "sex")) %>%
group_by (`region`, year) %>%
mutate (perc_women = as.numeric (sub ("%", "", perc_women (salary.x))))
model <- lm (log(salary.y) ~ year2.x + perc_women, data = tb)
summary(model) %>%
tidy() %>%
knitr::kable(
booktabs = TRUE,
caption = 'The correlation between the proportion of engineers who are women and the salaries of engineers in the region.')| term | estimate | std.error | statistic | p.value |
|---|---|---|---|---|
| (Intercept) | -30.8708500 | 4.2567427 | -7.252224 | 0 |
| year2.x | 0.0204578 | 0.0021284 | 9.611658 | 0 |
| perc_women | 0.0120317 | 0.0018553 | 6.485125 | 0 |
Anova(model, type=2) %>%
  tidy() %>%
  knitr::kable(
  booktabs = TRUE,
caption = 'Anova report from linear model fit') | term | sumsq | df | statistic | p.value |
|---|---|---|---|---|
| year2.x | 0.4587383 | 1 | 92.38397 | 0 |
| perc_women | 0.2088358 | 1 | 42.05684 | 0 |
| Residuals | 0.7299375 | 147 | NA | NA |
9.14 F-value for age compared to yearly increase in salary cleaned for the effect of age, Year 2004 - 2013
Average basic salary, monthly salary and women´s salary as a percentage of men´s salary by sector, occupational group (SSYK) , sex and age. Year 2004 - 2013 Monthly salary All sectors
tb <- readfile("AM0110E2.csv") %>%
  rowwise() %>%
  mutate(age2 = unlist(lapply(strsplit(substr(age, 1, 5), "-"), strtoi))[1]) %>%
  rowwise() %>%
  mutate(age3 = unlist(lapply(strsplit(substr(age, 1, 5), "-"), strtoi))[2]) %>%
  mutate(age4 = (age3 + age2) / 2)

summary_table = 0
anova_table = 0
for (i in unique(tb$`occupational group (SSYK)`)){
  temp <- filter(tb, `occupational group (SSYK)` == i)
  if (dim(temp)[1] > 50){
    model <- lm (log(salary) ~ year2 + sex + poly(age4, 3), data = temp)
    summary_table <- rbind (summary_table, mutate (mutate (tidy (summary (model)), ssyk = i), spannvidd = max (filter (temp, year2 == 2013)$salary) / min (filter (temp, year2 == 2013)$salary)))
    anova_table <- rbind (anova_table, mutate (tidy (Anova (model, type = 2)), ssyk = i))
  }
}

merge(summary_table, anova_table, by = "ssyk", all = TRUE) %>%
  filter (term.y == "poly(age4, 3)") %>%
  filter (term.x == "year2") %>%
  ggplot () +
    geom_point (mapping = aes(x = estimate, y = statistic.y))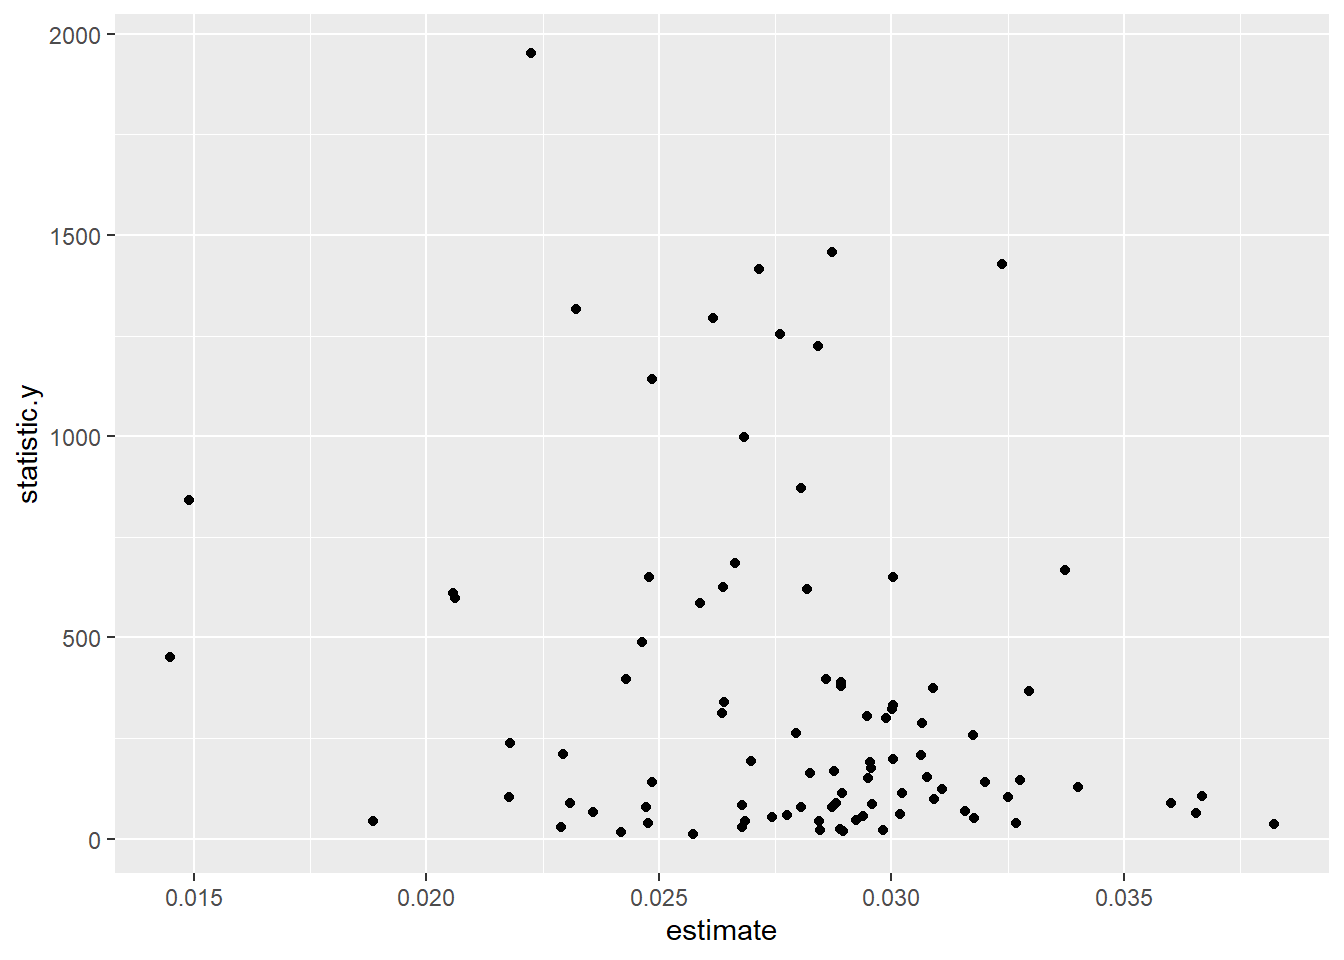
(#fig:ssyk14-18_7)F-value for age compared to yearly increase in salary cleaned for the effect of age
merge(summary_table, anova_table, by = "ssyk", all = TRUE) %>%
  filter (term.y == "poly(age4, 3)") %>%
  filter (term.x == "year2") %>%
  select (ssyk, estimate, statistic.y) %>%
  arrange (desc (statistic.y)) %>%
  knitr::kable(
  booktabs = TRUE,
caption = 'Correlation for F-value (age) and yearly increase in salaries cleaned for the effect of age') | ssyk | estimate | statistic.y |
|---|---|---|
| 233 Primary education teaching professionals | 0.0222522 | 1951.69188 |
| 222 Health professionals (except nursing) | 0.0287220 | 1457.04286 |
| 231 College, university and higher education teaching professionals | 0.0323762 | 1427.63618 |
| 122 Production and operations managers | 0.0271575 | 1416.37235 |
| 232 Secondary education teaching professionals | 0.0232175 | 1315.72047 |
| 312 Computer associate professionals | 0.0261719 | 1293.59017 |
| 323 Nursing associate professionals | 0.0275965 | 1253.47223 |
| 249 Psychologists, social work and related professionals | 0.0284160 | 1224.76753 |
| 214 Architects, engineers and related professionals | 0.0248582 | 1142.58491 |
| 331 Pre-primary education teaching associate professionals | 0.0268390 | 999.04369 |
| 341 Finance and sales associate professionals | 0.0280533 | 871.24552 |
| 011 Armed forces | 0.0148934 | 842.31457 |
| 213 Computing professionals | 0.0266410 | 684.64507 |
| 247 Public service administrative professionals | 0.0337322 | 668.36080 |
| 415 Mail carriers and sorting clerks | 0.0247880 | 649.49005 |
| 246 Religious professionals | 0.0300239 | 649.17379 |
| 345 Police officers and detectives | 0.0263753 | 625.49516 |
| 346 Social work associate professionals | 0.0281937 | 620.00016 |
| 245 Writers and creative or performing artists | 0.0205700 | 609.58554 |
| 211 Physicists, chemists and related professionals | 0.0206138 | 597.42679 |
| 241 Business professionals | 0.0258883 | 585.28238 |
| 322 Health associate professionals (except nursing) | 0.0246437 | 488.16340 |
| 235 Other teaching professionals | 0.0144847 | 450.42722 |
| 234 Special education teaching professionals | 0.0243006 | 396.46505 |
| 343 Administrative associate professionals | 0.0285844 | 395.88113 |
| 513 Personal care and related workers | 0.0289085 | 390.16452 |
| 815 Chemical-processing-plant operators | 0.0289092 | 379.39618 |
| 123 Other specialist managers | 0.0308923 | 374.21391 |
| 311 Physical and engineering science technicians | 0.0329471 | 365.90476 |
| 223 Nursing and midwifery professionals | 0.0264022 | 338.30668 |
| 515 Protective services workers | 0.0300250 | 330.90303 |
| 422 Client information clerks | 0.0300153 | 322.90797 |
| 243 Archivists, librarians and related information professionals | 0.0263611 | 312.02627 |
| 822 Chemical-products machine operators | 0.0294656 | 305.02965 |
| 419 Other office clerks | 0.0298857 | 300.21773 |
| 221 Life science professionals | 0.0306660 | 286.98782 |
| 324 Life science technicians | 0.0279558 | 261.87836 |
| 413 Stores and transport clerks | 0.0317471 | 256.92774 |
| 314 Ship and aircraft controllers and technicians | 0.0218090 | 237.48869 |
| 244 Social science and linguistics professionals (except social work professionals) | 0.0229451 | 210.55221 |
| 342 Business services agents and trade brokers | 0.0306404 | 207.12314 |
| 412 Numerical clerks | 0.0300400 | 196.86360 |
| 411 Office secretaries and data entry operators | 0.0269750 | 193.76835 |
| 829 Other machine operators and assemblers | 0.0295291 | 190.23514 |
| 721 Metal moulders, welders, sheet-metal workers, structural-metal preparers and related trades workers | 0.0295673 | 175.49681 |
| 823 Rubber- and plastic-products machine operators | 0.0287661 | 167.38463 |
| 313 Optical and electronic equipment operators | 0.0282529 | 162.50630 |
| 512 Housekeeping and restaurant services workers | 0.0307579 | 153.68491 |
| 722 Blacksmiths, tool-makers and related trades workers | 0.0295025 | 151.47248 |
| 315 Safety and quality inspectors | 0.0327656 | 145.56840 |
| 511 Travel attendants and related workers | 0.0248600 | 140.94823 |
| 344 Customs, tax and related government associate professionals | 0.0320078 | 140.50202 |
| 347 Artistic, entertainment and sports associate professionals | 0.0340164 | 126.91226 |
| 814 Wood-processing- and papermaking-plant operators | 0.0310770 | 122.20339 |
| 932 Manufacturing labourers | 0.0302280 | 113.71684 |
| 825 Printing-, binding- and paper-products machine operators | 0.0289276 | 113.27582 |
| 131 Managers of small enterprises | 0.0366800 | 104.47801 |
| 242 Legal professionals | 0.0325003 | 103.25042 |
| 248 Administrative professionals of special-interest organisations | 0.0217864 | 102.09489 |
| 723 Machinery mechanics and fitters | 0.0309173 | 97.76839 |
| 714 Painters, building structure cleaners and related trades workers | 0.0230825 | 89.43137 |
| 713 Building finishers and related trades workers | 0.0288156 | 88.76996 |
| 212 Mathematicians and statisticians | 0.0360177 | 87.18638 |
| 912 Helpers and cleaners | 0.0295741 | 84.83107 |
| 611 Market gardeners and crop growers | 0.0267796 | 82.14254 |
| 821 Metal- and mineral-products machine operators | 0.0247308 | 79.50551 |
| 812 Metal-processing-plant operators | 0.0280601 | 77.88761 |
| 828 Assemblers | 0.0287109 | 77.38124 |
| 831 Locomotive-engine drivers and related worker | 0.0315792 | 68.37296 |
| 734 Craft printing and related trades workers | 0.0235737 | 66.46350 |
| 724 Electrical and electronic equipment mechanics and fitters | 0.0365407 | 64.27696 |
| 913 Helpers in restaurants | 0.0301832 | 60.46244 |
| 914 Doorkeepers, newspaper and package deliverers and related workers | 0.0277470 | 58.60471 |
| 121 Directors and chief executives | 0.0293868 | 55.09215 |
| 514 Other personal services workers | 0.0274374 | 52.59568 |
| 833 Agricultural and other mobile-plant operators | 0.0317821 | 51.72220 |
| 933 Transport labourers and freight handlers | 0.0292293 | 46.02971 |
| 826 Textile-, fur- and leather-products machine operators | 0.0268432 | 43.06312 |
| 824 Wood-products machine operators | 0.0284347 | 42.56020 |
| 332 Other teaching associate professionals | 0.0188570 | 42.34720 |
| 612 Animal producers and related workers | 0.0247740 | 39.10006 |
| 522 Shop and stall salespersons and demonstrators | 0.0326857 | 38.81291 |
| 321 Agronomy and forestry technicians | 0.0382170 | 37.04074 |
| 915 Garbage collectors and related labourers | 0.0228931 | 29.19059 |
| 816 Power-production and related plant operators | 0.0267858 | 27.65173 |
| 712 Building frame and related trades workers | 0.0288961 | 24.53035 |
| 414 Library and filing clerks | 0.0284717 | 20.67900 |
| 832 Motor-vehicle drivers | 0.0298189 | 20.31541 |
| 827 Food and related products machine operators | 0.0289659 | 19.18984 |
| 421 Cashiers, tellers and related clerks | 0.0241952 | 15.24343 |
| 919 Other sales and services elementary occupations | 0.0257387 | 10.27841 |
9.15 F-value for age compared to yearly increase in salary cleaned for the effect of age, Year 2014 - 2018
Average basic salary, monthly salary and women´s salary as a percentage of men´s salary by sector, occupational group (SSYK 2012) , sex and age. Year 2014 - 2018 Monthly salary All sectors
tb <- readfile("000000D2_1.csv") %>%
  rowwise() %>%
  mutate(age2 = unlist(lapply(strsplit(substr(age, 1, 5), "-"), strtoi))[1]) %>%
  rowwise() %>%
  mutate(age3 = unlist(lapply(strsplit(substr(age, 1, 5), "-"), strtoi))[2]) %>%
  mutate(age4 = (age3 + age2) / 2)

summary_table = 0
anova_table = 0
for (i in unique(tb$`occuptional  (SSYK 2012)`)){
  temp <- filter(tb, `occuptional  (SSYK 2012)` == i)
  if (dim(temp)[1] > 50){
    model <- lm (log(salary) ~ year2 + sex + poly(age4, 3), data = temp)
    summary_table <- rbind (summary_table, mutate (mutate (tidy (summary (model)), ssyk = i), spannvidd = max (filter (temp, year2 == 2018)$salary) / min (filter (temp, year2 == 2018)$salary)))
    anova_table <- rbind (anova_table, mutate (tidy (Anova (model, type = 2)), ssyk = i))
  }
}

merge(summary_table, anova_table, by = "ssyk", all = TRUE) %>%
  filter (term.y == "poly(age4, 3)") %>%
  filter (term.x == "year2") %>%
  ggplot () +
    geom_point (mapping = aes(x = estimate, y = statistic.y))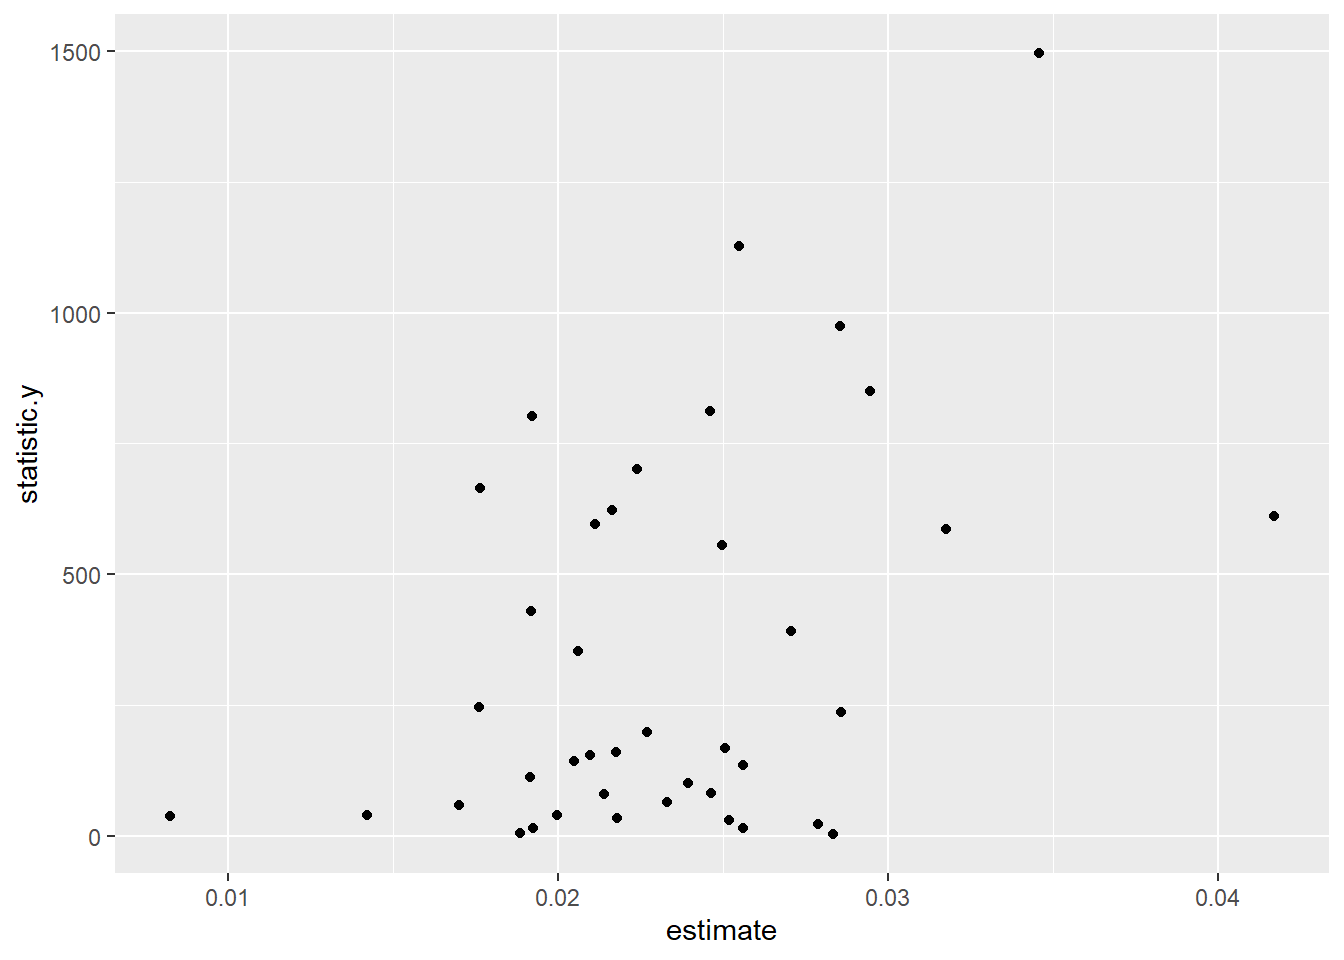
(#fig:ssyk14-18_8)F-value for age compared to yearly increase in salary cleaned for the effect of age
merge(summary_table, anova_table, by = "ssyk", all = TRUE) %>%
  filter (term.y == "poly(age4, 3)") %>%
  filter (term.x == "year2") %>%
  select (ssyk, estimate, statistic.y) %>%
  arrange (desc (statistic.y)) %>%
  knitr::kable(
  booktabs = TRUE,
caption = 'Correlation for F-value (age) and yearly increase in salaries cleaned for the effect of age') | ssyk | estimate | statistic.y |
|---|---|---|
| 234 Primary- and pre-school teachers | 0.0345563 | 1496.606988 |
| 231 University and higher education teachers | 0.0254827 | 1127.841359 |
| 532 Personal care workers in health services | 0.0285338 | 975.453302 |
| 233 Secondary education teachers | 0.0294574 | 849.896621 |
| 235 Teaching professionals not elsewhere classified | 0.0245885 | 812.791078 |
| 214 Engineering professionals | 0.0192045 | 801.889286 |
| 242 Organisation analysts, policy administrators and human resource specialists | 0.0223881 | 701.614565 |
| 332 Insurance advisers, sales and purchasing agents | 0.0176134 | 664.442254 |
| 531 Child care workers and teachers aides | 0.0216205 | 622.684596 |
| 222 Nursing professionals | 0.0416796 | 611.433214 |
| 351 ICT operations and user support technicians | 0.0211211 | 596.249682 |
| 266 Social work and counselling professionals | 0.0317545 | 587.044065 |
| 251 ICT architects, systems analysts and test managers | 0.0249600 | 555.431565 |
| 534 Attendants, personal assistants and related workers | 0.0191811 | 428.571695 |
| 241 Accountants, financial analysts and fund managers | 0.0270620 | 391.870288 |
| 533 Health care assistants | 0.0205813 | 352.960310 |
| 422 Client information clerks | 0.0175877 | 245.488178 |
| 321 Medical and pharmaceutical technicians | 0.0285567 | 236.191372 |
| 335 Tax and related government associate professionals | 0.0227003 | 198.582732 |
| 411 Office assistants and other secretaries | 0.0250406 | 166.766194 |
| 331 Financial and accounting associate professionals | 0.0217619 | 158.923954 |
| 311 Physical and engineering science technicians | 0.0209631 | 154.667997 |
| 723 Machinery mechanics and fitters | 0.0204855 | 142.874499 |
| 341 Social work and religious associate professionals | 0.0255936 | 134.606247 |
| 515 Building caretakers and related workers | 0.0191368 | 111.384579 |
| 541 Other surveillance and security workers | 0.0239438 | 99.793943 |
| 333 Business services agents | 0.0246292 | 80.618256 |
| 227 Naprapaths, physiotherapists, occupational therapists | 0.0213986 | 80.052441 |
| 819 Process control technicians | 0.0232825 | 65.100656 |
| 911 Cleaners and helpers | 0.0169943 | 58.927493 |
| 941 Fast-food workers, food preparation assistants | 0.0199578 | 40.150153 |
| 962 Newspaper distributors, janitors and other service workers | 0.0141958 | 39.069854 |
| 611 Market gardeners and crop growers | 0.0082242 | 37.208581 |
| 432 Stores and transport clerks | 0.0217702 | 33.903777 |
| 834 Mobile plant operators | 0.0251657 | 29.791104 |
| 512 Cooks and cold-buffet managers | 0.0278549 | 22.750271 |
| 722 Blacksmiths, toolmakers and related trades workers | 0.0192278 | 14.874887 |
| 522 Shop staff | 0.0255930 | 14.735285 |
| 833 Heavy truck and bus drivers | 0.0188392 | 4.531345 |
| 821 Assemblers | 0.0283101 | 2.226122 |
9.16 Women’s urbanization, comparison between the SSYK, population dependence, Year 2003 - 2013
Average basic salary, monthly salary and women´s salary as a percentage of men´s salary by region, sector, occupational group (SSYK) and sex. Year 2003 - 2013 Number of employees All sectors
tb <- readfile("AM0110A4_2.csv")

summary_table = 0
anova_table = 0
tb <- tb %>%
  group_by (`region`, year, `occupational group (SSYK)`) %>%
  mutate (perc_women = as.numeric (sub ("%", "", perc_women (salary)))) %>%
  group_by(region, year) %>%
  mutate(sum_pop = sum(salary))
for (i in unique(tb$`occupational group (SSYK)`)){
  temp <- filter(tb, `occupational group (SSYK)` == i)
  if (dim(temp)[1] > 50){
    model <- lm(perc_women ~ sum_pop + year2, data = temp)
    summary_table <- rbind (summary_table, mutate (mutate (tidy (summary (model)), ssyk = i), spannvidd = max (filter (temp, year2 == 2013)$salary) / min (filter (temp, year2 == 2013)$salary)))
    anova_table <- rbind (anova_table, mutate (tidy (Anova (model, type = 2)), ssyk = i))
  }
}
## Note: model has aliased coefficients
## sums of squares computed by model comparisonmerge(summary_table, anova_table, by = "ssyk", all = TRUE) %>%
filter (term.y == "sum_pop") %>%
filter (term.x == "sum_pop") %>%
ggplot () +
geom_point (mapping = aes(x = estimate, y = statistic.y)) +
labs(
x = "estimate",
y = "F value for SSYK"
) 
(#fig:ssyk14-18_9)Womens urbanization, comparison between the SSYK, Year 2014 - 2018, positive x = tendency for women within SSYK to migrate to larger regions, negative x = tendency for women within SSYK to migrate to smaller regions
merge(summary_table, anova_table, by = "ssyk", all = TRUE) %>%
filter (term.y == "sum_pop") %>%
filter (term.x == "sum_pop") %>%
select (ssyk, estimate, statistic.y) %>%
arrange (desc (statistic.y)) %>%
knitr::kable(
booktabs = TRUE,
caption = 'Womens urbanization, comparison between the SSYK, Year 2003 - 2013') | ssyk | estimate | statistic.y |
|---|---|---|
| 321 Agronomy and forestry technicians | 6.89e-05 | 1063.8292979 |
| 814 Wood-processing- and papermaking-plant operators | 1.85e-05 | 564.8688266 |
| 221 Life science professionals | 3.68e-05 | 252.4643108 |
| 826 Textile-, fur- and leather-products machine operators | -6.81e-05 | 250.8778596 |
| 311 Physical and engineering science technicians | 6.70e-06 | 243.9579072 |
| 822 Chemical-products machine operators | 4.16e-05 | 186.4551637 |
| 512 Housekeeping and restaurant services workers | -3.55e-05 | 165.2195745 |
| 222 Health professionals (except nursing) | 8.80e-06 | 159.1321126 |
| 912 Helpers and cleaners | -3.35e-05 | 152.0551830 |
| 345 Police officers and detectives | 6.50e-06 | 145.1628182 |
| 913 Helpers in restaurants | -3.05e-05 | 139.9663729 |
| 123 Other specialist managers | 1.02e-05 | 133.9974558 |
| 214 Architects, engineers and related professionals | 7.90e-06 | 90.7204155 |
| 232 Secondary education teaching professionals | 4.90e-06 | 79.7756403 |
| 323 Nursing associate professionals | 1.90e-06 | 77.2529656 |
| 828 Assemblers | -1.69e-05 | 63.4276805 |
| 515 Protective services workers | 6.90e-06 | 58.8211210 |
| 131 Managers of small enterprises | 9.90e-06 | 58.0455582 |
| 249 Psychologists, social work and related professionals | -3.70e-06 | 56.0577280 |
| 414 Library and filing clerks | -1.43e-05 | 51.0486557 |
| 412 Numerical clerks | -5.90e-06 | 40.4612509 |
| 816 Power-production and related plant operators | -5.50e-06 | 36.4018548 |
| 815 Chemical-processing-plant operators | 2.77e-05 | 34.8057925 |
| 346 Social work associate professionals | -5.50e-06 | 33.6775476 |
| 413 Stores and transport clerks | 6.50e-06 | 33.1596176 |
| 825 Printing-, binding- and paper-products machine operators | -1.31e-05 | 30.0905987 |
| 241 Business professionals | -6.00e-06 | 29.1297561 |
| 932 Manufacturing labourers | 1.09e-05 | 28.6839067 |
| 331 Pre-primary education teaching associate professionals | 1.50e-06 | 27.0837611 |
| 832 Motor-vehicle drivers | 4.90e-06 | 26.1357552 |
| 341 Finance and sales associate professionals | 5.50e-06 | 25.7516389 |
| 411 Office secretaries and data entry operators | -1.25e-05 | 25.4240116 |
| 247 Public service administrative professionals | 3.70e-06 | 24.3480698 |
| 231 College, university and higher education teaching professionals | -3.20e-06 | 22.0484247 |
| 111 Legislators and senior government officials | 6.70e-06 | 15.8424018 |
| 419 Other office clerks | -3.30e-06 | 15.5967644 |
| 933 Transport labourers and freight handlers | -9.30e-06 | 14.6766564 |
| 242 Legal professionals | -5.00e-06 | 13.4616919 |
| 514 Other personal services workers | -1.30e-05 | 12.7524231 |
| 513 Personal care and related workers | -2.60e-06 | 11.4225115 |
| 511 Travel attendants and related workers | 1.77e-05 | 11.2070758 |
| 415 Mail carriers and sorting clerks | -6.80e-06 | 10.9993756 |
| 211 Physicists, chemists and related professionals | 1.42e-05 | 10.7242720 |
| 315 Safety and quality inspectors | 7.80e-06 | 9.4952835 |
| 223 Nursing and midwifery professionals | 2.10e-06 | 8.7877674 |
| 313 Optical and electronic equipment operators | -1.70e-05 | 8.2244191 |
| 421 Cashiers, tellers and related clerks | -9.60e-06 | 6.6756545 |
| 344 Customs, tax and related government associate professionals | 3.10e-06 | 6.6499868 |
| 246 Religious professionals | 1.00e-05 | 6.6417584 |
| 833 Agricultural and other mobile-plant operators | -7.20e-06 | 6.3150838 |
| 122 Production and operations managers | -3.00e-06 | 6.1124364 |
| 821 Metal- and mineral-products machine operators | -2.90e-06 | 5.5545700 |
| 829 Other machine operators and assemblers | -3.90e-06 | 5.3658038 |
| 235 Other teaching professionals | -3.10e-06 | 4.8483487 |
| 322 Health associate professionals (except nursing) | 1.40e-06 | 4.2865473 |
| 121 Directors and chief executives | 5.70e-06 | 4.2290452 |
| 812 Metal-processing-plant operators | -5.30e-06 | 3.3375084 |
| 611 Market gardeners and crop growers | -6.80e-06 | 3.1968190 |
| 827 Food and related products machine operators | -6.20e-06 | 2.8037469 |
| 831 Locomotive-engine drivers and related worker | 1.94e-05 | 2.2979810 |
| 919 Other sales and services elementary occupations | -2.30e-06 | 1.9045323 |
| 914 Doorkeepers, newspaper and package deliverers and related workers | 2.00e-06 | 1.7352638 |
| 724 Electrical and electronic equipment mechanics and fitters | -2.20e-06 | 1.3265619 |
| 324 Life science technicians | -1.40e-06 | 1.2988170 |
| 422 Client information clerks | 1.80e-06 | 1.1037460 |
| 245 Writers and creative or performing artists | 1.30e-06 | 0.9519936 |
| 243 Archivists, librarians and related information professionals | -1.20e-06 | 0.8667095 |
| 343 Administrative associate professionals | -9.00e-07 | 0.8099945 |
| 244 Social science and linguistics professionals (except social work professionals) | -3.60e-06 | 0.7938810 |
| 011 Armed forces | -9.00e-07 | 0.7409832 |
| 712 Building frame and related trades workers | 9.00e-07 | 0.6206295 |
| 342 Business services agents and trade brokers | -8.00e-07 | 0.4080769 |
| 823 Rubber- and plastic-products machine operators | -2.70e-06 | 0.3376290 |
| 713 Building finishers and related trades workers | 3.00e-07 | 0.3320734 |
| 824 Wood-products machine operators | 2.00e-06 | 0.2840136 |
| 522 Shop and stall salespersons and demonstrators | -8.00e-07 | 0.2706724 |
| 233 Primary education teaching professionals | 2.00e-07 | 0.2217668 |
| 723 Machinery mechanics and fitters | -2.00e-07 | 0.1640692 |
| 312 Computer associate professionals | -3.00e-07 | 0.0551337 |
| 213 Computing professionals | -2.00e-07 | 0.0357450 |
| 234 Special education teaching professionals | -1.00e-07 | 0.0073434 |
9.17 Women’s urbanization, comparison between the SSYK, population dependence, Year 2014 - 2018
Average basic salary, monthly salary and women´s salary as a percentage of men´s salary by region, sector, occupational group (SSYK 2012) and sex . Year 2014 - 2018 Number of employees All sectors
tb <- readfile("000000CD_13.csv")
summary_table = 0
anova_table = 0
tb <- tb %>%
group_by (`region`, year, `occuptional (SSYK 2012)`) %>%
mutate (perc_women = as.numeric (sub ("%", "", perc_women (salary)))) %>%
group_by(region, year) %>%
mutate(sum_pop = sum(salary))
for (i in unique(tb$`occuptional (SSYK 2012)`)){
temp <- filter(tb, `occuptional (SSYK 2012)` == i)
if (dim(temp)[1] > 50){
model <- lm(perc_women ~ sum_pop + year2, data = temp)
summary_table <- rbind (summary_table, mutate (mutate (tidy (summary (model)), ssyk = i), spannvidd = max (filter (temp, year2 == 2018)$salary) / min (filter (temp, year2 == 2018)$salary)))
anova_table <- rbind (anova_table, mutate (tidy (Anova (model, type = 2)), ssyk = i))
}
}
merge(summary_table, anova_table, by = "ssyk", all = TRUE) %>%
  filter (term.y == "sum_pop") %>%
  filter (term.x == "sum_pop") %>%
  ggplot () +
    geom_point (mapping = aes(x = estimate, y = statistic.y)) +
    labs(
      x = "estimate",
      y = "F value for SSYK"
) 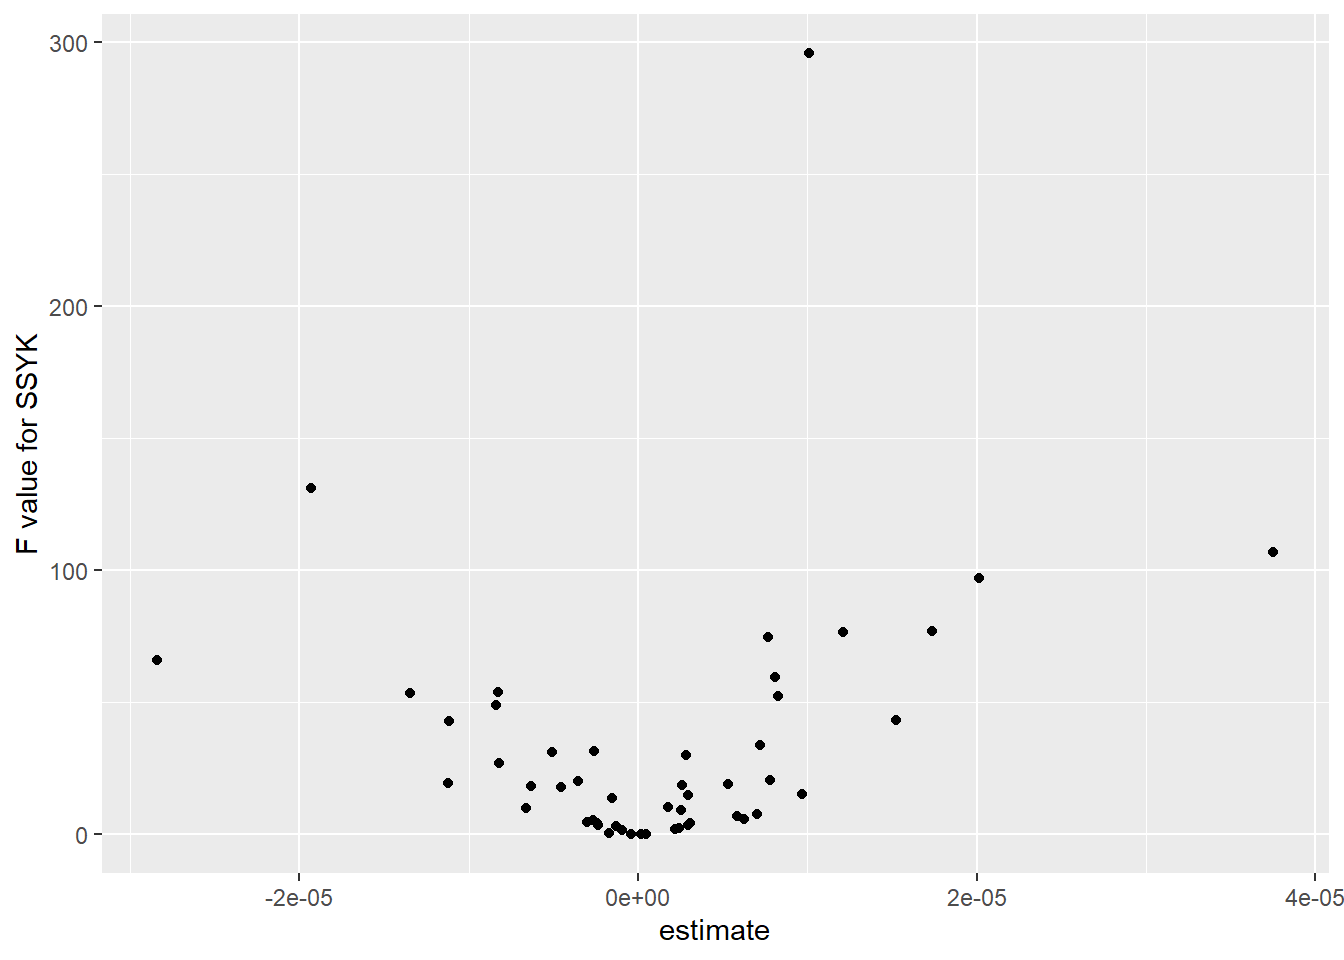
(#fig:ssyk14-18_10)Womens urbanization, comparison between the SSYK, Year 2014 - 2018, positive x = tendency for women within SSYK to migrate to larger regions, negative x = tendency for women within SSYK to migrate to smaller regions
merge(summary_table, anova_table, by = "ssyk", all = TRUE) %>%
  filter (term.y == "sum_pop") %>%
  filter (term.x == "sum_pop") %>%
  select (ssyk, estimate, statistic.y) %>%
  arrange (desc (statistic.y)) %>%
  knitr::kable(
  booktabs = TRUE,
caption = 'Womens urbanization, comparison between the SSYK, Year 2014 - 2018') | ssyk | estimate | statistic.y |
|---|---|---|
| 214 Engineering professionals | 1.01e-05 | 295.7120388 |
| 441 Library and filing clerks | -1.93e-05 | 131.3075554 |
| 213 Biologists, pharmacologists and specialists in agriculture and forestry | 3.75e-05 | 106.8084503 |
| 125 Sales and marketing managers | 2.01e-05 | 97.2212141 |
| 232 Vocational education teachers | 1.74e-05 | 77.1493980 |
| 134 Architectural and engineering managers | 1.21e-05 | 76.7866348 |
| 311 Physical and engineering science technicians | 7.70e-06 | 74.8367365 |
| 911 Cleaners and helpers | -2.84e-05 | 66.1971134 |
| 221 Medical doctors | 8.10e-06 | 59.6028879 |
| 262 Museum curators and librarians and related professionals | -8.20e-06 | 53.7628051 |
| 241 Accountants, financial analysts and fund managers | -1.35e-05 | 53.5010341 |
| 141 Primary and secondary schools and adult education managers | 8.30e-06 | 52.5065690 |
| 242 Organisation analysts, policy administrators and human resource specialists | -8.40e-06 | 49.1200001 |
| 129 Administration and service managers not elsewhere classified | 1.53e-05 | 43.1139309 |
| 261 Legal professionals | -1.12e-05 | 42.8894144 |
| 224 Psychologists and psychotherapists | 7.20e-06 | 33.7388945 |
| 234 Primary- and pre-school teachers | -2.60e-06 | 31.4538561 |
| 411 Office assistants and other secretaries | -5.10e-06 | 31.3747529 |
| 222 Nursing professionals | 2.80e-06 | 29.9015182 |
| 962 Newspaper distributors, janitors and other service workers | -8.20e-06 | 27.1998547 |
| 332 Insurance advisers, sales and purchasing agents | 7.80e-06 | 20.7025003 |
| 532 Personal care workers in health services | -3.50e-06 | 20.1222435 |
| 243 Marketing and public relations professionals | -1.12e-05 | 19.5869423 |
| 159 Other social services managers | 5.30e-06 | 19.0970453 |
| 223 Nursing professionals (cont.) | 2.60e-06 | 18.7455886 |
| 331 Financial and accounting associate professionals | -6.30e-06 | 18.4866717 |
| 335 Tax and related government associate professionals | -4.60e-06 | 17.7634619 |
| 515 Building caretakers and related workers | 9.70e-06 | 15.2319657 |
| 227 Naprapaths, physiotherapists, occupational therapists | 3.00e-06 | 14.7936021 |
| 266 Social work and counselling professionals | -1.50e-06 | 13.7487061 |
| 336 Police officers | 1.80e-06 | 10.3872611 |
| 333 Business services agents | -6.60e-06 | 10.1427348 |
| 819 Process control technicians | 2.50e-06 | 9.2296330 |
| 123 Administration and planning managers | 7.00e-06 | 7.8311381 |
| 341 Social work and religious associate professionals | 5.90e-06 | 6.9756456 |
| 422 Client information clerks | 6.30e-06 | 5.8149395 |
| 151 Health care managers | -2.60e-06 | 5.5228329 |
| 251 ICT architects, systems analysts and test managers | -3.00e-06 | 4.6258473 |
| 541 Other surveillance and security workers | -2.40e-06 | 4.1592861 |
| 321 Medical and pharmaceutical technicians | 3.10e-06 | 4.1444866 |
| 218 Specialists within environmental and health protection | 3.00e-06 | 3.6257049 |
| 231 University and higher education teachers | -2.40e-06 | 3.3708760 |
| 233 Secondary education teachers | -1.30e-06 | 3.1488440 |
| 432 Stores and transport clerks | 2.40e-06 | 2.3799201 |
| 351 ICT operations and user support technicians | 2.20e-06 | 1.9880575 |
| 531 Child care workers and teachers aides | -1.00e-06 | 1.8373728 |
| 131 Information and communications technology service managers | -1.70e-06 | 0.5228535 |
| 153 Elderly care managers | 5.00e-07 | 0.3368178 |
| 534 Attendants, personal assistants and related workers | -4.00e-07 | 0.1490330 |
| 235 Teaching professionals not elsewhere classified | 5.00e-07 | 0.1244418 |
| 533 Health care assistants | 2.00e-07 | 0.0104101 |
9.18 Women’s urbanization, comparison between the SSYK, salary dependence, Year 2003 - 2013
Average basic salary, monthly salary and women´s salary as a percentage of men´s salary by region, sector, occupational group (SSYK) and sex. Year 2003 - 2013 Number of employees All sectors
Monthly salary All sectors
tb <- readfile("AM0110A4_2.csv")

summary_table = 0
anova_table = 0
tb <- tb %>%
  group_by (`region`, year, `occupational group (SSYK)`) %>%
  mutate (perc_women = as.numeric (sub ("%", "", perc_women (salary)))) %>%
  group_by(region, year) %>%
  mutate(sum_pop = sum(salary))
tb <- readfile("AM0110A2_2.csv") %>%
  inner_join(tb, by = c("region", "year", "sex", "occupational group (SSYK)"))
for (i in unique(tb$`occupational group (SSYK)`)){
  temp <- filter(tb, `occupational group (SSYK)` == i)
  if (dim(temp)[1] > 50){
    model <- lm(perc_women ~ log(salary.x) + year2.x + sex, data = temp)
    summary_table <- rbind (summary_table, mutate (mutate (tidy (summary (model)), ssyk = i)))
    anova_table <- rbind (anova_table, mutate (tidy (Anova (model, type = 2)), ssyk = i))
  }
}
## Note: model has aliased coefficients
## sums of squares computed by model comparisonmerge(summary_table, anova_table, by = "ssyk", all = TRUE) %>%
filter (term.y == "log(salary.x)") %>%
filter (term.x == "log(salary.x)") %>%
ggplot () +
geom_point (mapping = aes(x = estimate, y = statistic.y)) +
labs(
x = "estimate",
y = "F value for SSYK"
) 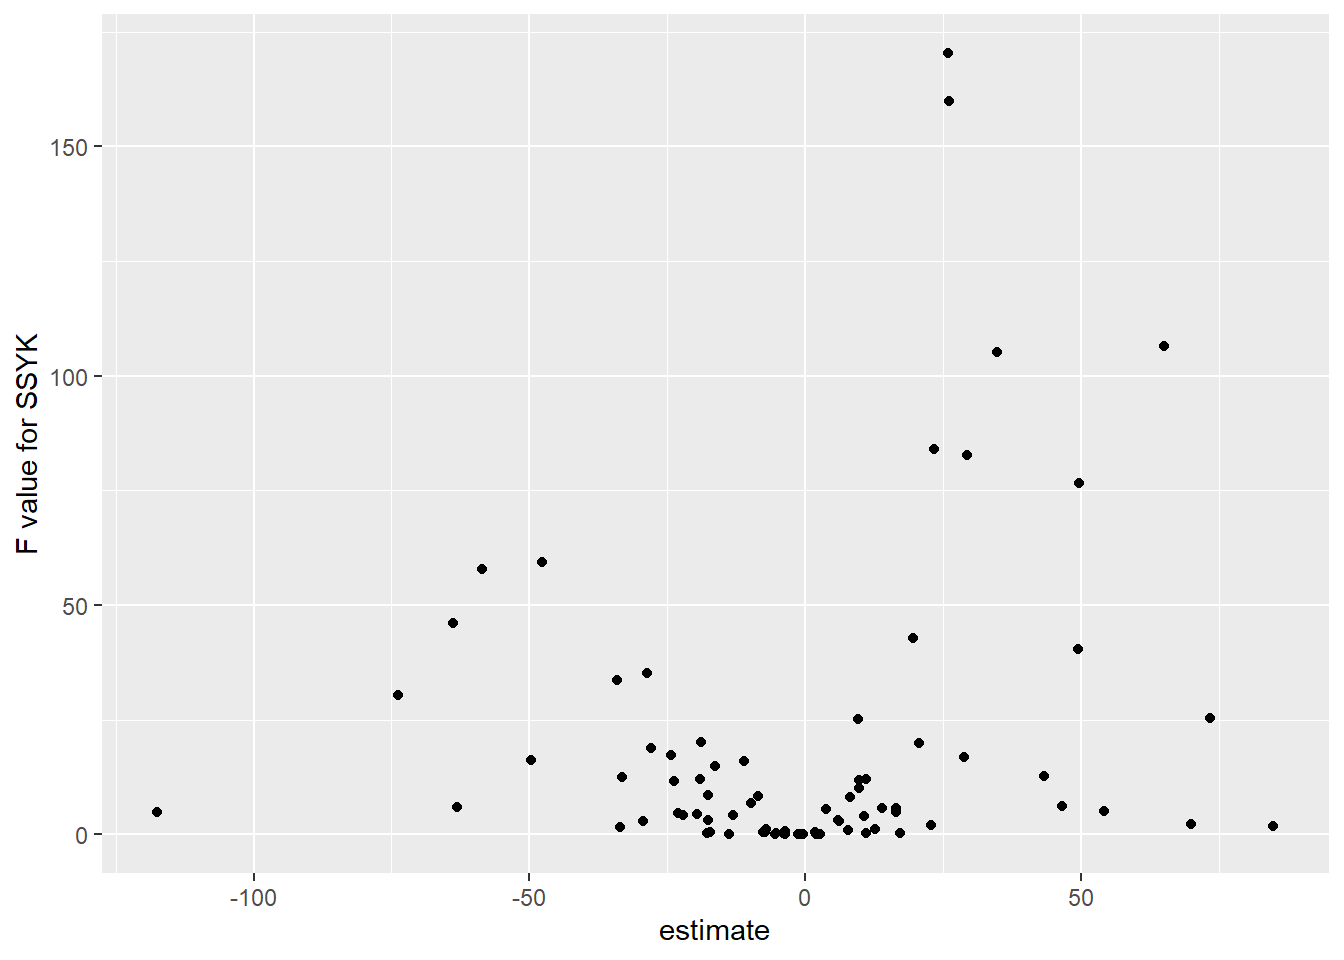
(#fig:ssyk14-18_11)Womens urbanization, comparison between the SSYK, Year 2003 - 2013, positive x = tendency for women within SSYK to migrate to regions with higher salaries, negative x = tendency for women within SSYK to migrate to regions with lower salaries
merge(summary_table, anova_table, by = "ssyk", all = TRUE) %>%
filter (term.y == "log(salary.x)") %>%
filter (term.x == "log(salary.x)") %>%
select (ssyk, estimate, statistic.y) %>%
arrange (desc (statistic.y)) %>%
knitr::kable(
booktabs = TRUE,
caption = 'Womens urbanization, comparison between the SSYK, Year 2003 - 2013') | ssyk | estimate | statistic.y |
|---|---|---|
| 123 Other specialist managers | 25.8787109 | 170.3374227 |
| 311 Physical and engineering science technicians | 26.1163477 | 159.9096161 |
| 211 Physicists, chemists and related professionals | 65.0289762 | 106.5661612 |
| 214 Architects, engineers and related professionals | 34.7999695 | 105.1626033 |
| 345 Police officers and detectives | 23.3684266 | 84.0420219 |
| 131 Managers of small enterprises | 29.3507967 | 82.6987698 |
| 221 Life science professionals | 49.6106340 | 76.5555516 |
| 411 Office secretaries and data entry operators | -47.6314753 | 59.3312856 |
| 414 Library and filing clerks | -58.5878570 | 57.9436255 |
| 919 Other sales and services elementary occupations | -63.8548847 | 46.0637678 |
| 341 Finance and sales associate professionals | 19.5694184 | 42.8489739 |
| 232 Secondary education teaching professionals | 49.5262136 | 40.5058269 |
| 412 Numerical clerks | -28.7129046 | 35.0830272 |
| 222 Health professionals (except nursing) | -34.0820318 | 33.6768753 |
| 828 Assemblers | -73.8980268 | 30.3714326 |
| 822 Chemical-products machine operators | 73.3334971 | 25.3239902 |
| 323 Nursing associate professionals | 9.4754081 | 25.0575064 |
| 419 Other office clerks | -18.8841567 | 20.2438674 |
| 833 Agricultural and other mobile-plant operators | 20.6964331 | 20.0214137 |
| 933 Transport labourers and freight handlers | -27.9227454 | 18.8553169 |
| 244 Social science and linguistics professionals (except social work professionals) | -24.2564582 | 17.4058195 |
| 315 Safety and quality inspectors | 28.7227212 | 16.8591720 |
| 815 Chemical-processing-plant operators | -49.6794191 | 16.1639578 |
| 241 Business professionals | -11.1459268 | 16.0893376 |
| 821 Metal- and mineral-products machine operators | -16.2693685 | 14.9696946 |
| 511 Travel attendants and related workers | 43.3101952 | 12.7213259 |
| 413 Stores and transport clerks | -33.1937595 | 12.5420915 |
| 247 Public service administrative professionals | 11.0598948 | 12.1609171 |
| 249 Psychologists, social work and related professionals | -19.0157284 | 12.1357673 |
| 121 Directors and chief executives | 9.6653091 | 11.8925557 |
| 344 Customs, tax and related government associate professionals | -23.7826041 | 11.5428566 |
| 111 Legislators and senior government officials | 9.7549772 | 10.0145115 |
| 235 Other teaching professionals | -17.7058552 | 8.5403192 |
| 713 Building finishers and related trades workers | -8.5084387 | 8.3259510 |
| 213 Computing professionals | 8.1182792 | 8.0631052 |
| 242 Legal professionals | -9.8978296 | 6.8935447 |
| 824 Wood-products machine operators | 46.4966519 | 6.2881429 |
| 823 Rubber- and plastic-products machine operators | -63.1633132 | 5.9217639 |
| 816 Power-production and related plant operators | 16.5252880 | 5.7949114 |
| 223 Nursing and midwifery professionals | 13.8408709 | 5.7365939 |
| 723 Machinery mechanics and fitters | 3.7086439 | 5.5167985 |
| 321 Agronomy and forestry technicians | 54.1442164 | 5.1600245 |
| 832 Motor-vehicle drivers | 16.4949754 | 4.9859931 |
| 512 Housekeeping and restaurant services workers | -117.4415992 | 4.8097428 |
| 346 Social work associate professionals | -23.0070114 | 4.6554733 |
| 522 Shop and stall salespersons and demonstrators | -19.5808129 | 4.4896508 |
| 342 Business services agents and trade brokers | -13.0699044 | 4.3229861 |
| 515 Protective services workers | -22.1098204 | 4.2145376 |
| 322 Health associate professionals (except nursing) | 10.7280378 | 4.0198024 |
| 233 Primary education teaching professionals | 5.9368753 | 3.1106372 |
| 829 Other machine operators and assemblers | -17.5601082 | 3.0869220 |
| 825 Printing-, binding- and paper-products machine operators | -29.3208137 | 2.9696055 |
| 245 Writers and creative or performing artists | 6.1792176 | 2.8515571 |
| 913 Helpers in restaurants | 69.8479894 | 2.3015343 |
| 932 Manufacturing labourers | 22.8000144 | 1.9976237 |
| 826 Textile-, fur- and leather-products machine operators | 84.8122054 | 1.9315719 |
| 812 Metal-processing-plant operators | -33.6103106 | 1.6710200 |
| 234 Special education teaching professionals | 12.5779182 | 1.2721725 |
| 243 Archivists, librarians and related information professionals | -7.0838299 | 1.1275366 |
| 914 Doorkeepers, newspaper and package deliverers and related workers | 7.7021356 | 1.0366771 |
| 122 Production and operations managers | -3.6643377 | 0.6933617 |
| 011 Armed forces | 1.6956196 | 0.5823651 |
| 513 Personal care and related workers | -7.6874977 | 0.5218200 |
| 422 Client information clerks | -7.3272824 | 0.4888683 |
| 313 Optical and electronic equipment operators | -17.2262344 | 0.4686892 |
| 324 Life science technicians | -5.2305361 | 0.3998384 |
| 724 Electrical and electronic equipment mechanics and fitters | -3.9523747 | 0.3407023 |
| 421 Cashiers, tellers and related clerks | 11.0290213 | 0.3239142 |
| 246 Religious professionals | 17.1532898 | 0.3207119 |
| 415 Mail carriers and sorting clerks | -17.8325528 | 0.2506752 |
| 343 Administrative associate professionals | -1.3593611 | 0.1554629 |
| 331 Pre-primary education teaching associate professionals | -0.8601808 | 0.1418893 |
| 712 Building frame and related trades workers | 1.9935962 | 0.1375431 |
| 514 Other personal services workers | -5.5426646 | 0.0700792 |
| 312 Computer associate professionals | -1.0839786 | 0.0581261 |
| 912 Helpers and cleaners | -13.8224170 | 0.0558828 |
| 831 Locomotive-engine drivers and related worker | -3.7374339 | 0.0256549 |
| 827 Food and related products machine operators | 2.6007849 | 0.0116346 |
| 814 Wood-processing- and papermaking-plant operators | -0.8430777 | 0.0105995 |
| 231 College, university and higher education teaching professionals | -0.4741251 | 0.0039935 |
| 611 Market gardeners and crop growers | -1.0208046 | 0.0028677 |
9.19 Women’s urbanization, comparison between the SSYK, salary dependence, Year 2014 - 2018
Average basic salary, monthly salary and women´s salary as a percentage of men´s salary by region, sector, occupational group (SSYK 2012) and sex . Year 2014 - 2018 Number of employees All sectors
Monthly salary All sectors
tb <- readfile("000000CD_13.csv")
summary_table = 0
anova_table = 0
tb <- tb %>%
group_by (`region`, year, `occuptional (SSYK 2012)`) %>%
mutate (perc_women = as.numeric (sub ("%", "", perc_women (salary)))) %>%
group_by(region, year) %>%
mutate(sum_pop = sum(salary))
tb <- readfile("000000CG_3.csv") %>%
inner_join(tb, by = c("region", "year", "sex", "occuptional (SSYK 2012)"))
for (i in unique(tb$`occuptional (SSYK 2012)`)){
temp <- filter(tb, `occuptional (SSYK 2012)` == i)
if (dim(temp)[1] > 50){
model <- lm(perc_women ~ log(salary.x) + year2.x + sex, data = temp)
summary_table <- rbind (summary_table, mutate (mutate (tidy (summary (model)), ssyk = i)))
anova_table <- rbind (anova_table, mutate (tidy (Anova (model, type = 2)), ssyk = i))
}
}
merge(summary_table, anova_table, by = "ssyk", all = TRUE) %>%
  filter (term.y == "log(salary.x)") %>%
  filter (term.x == "log(salary.x)") %>%
  ggplot () +
    geom_point (mapping = aes(x = estimate, y = statistic.y)) +
    labs(
      x = "estimate",
      y = "F value for SSYK"
) 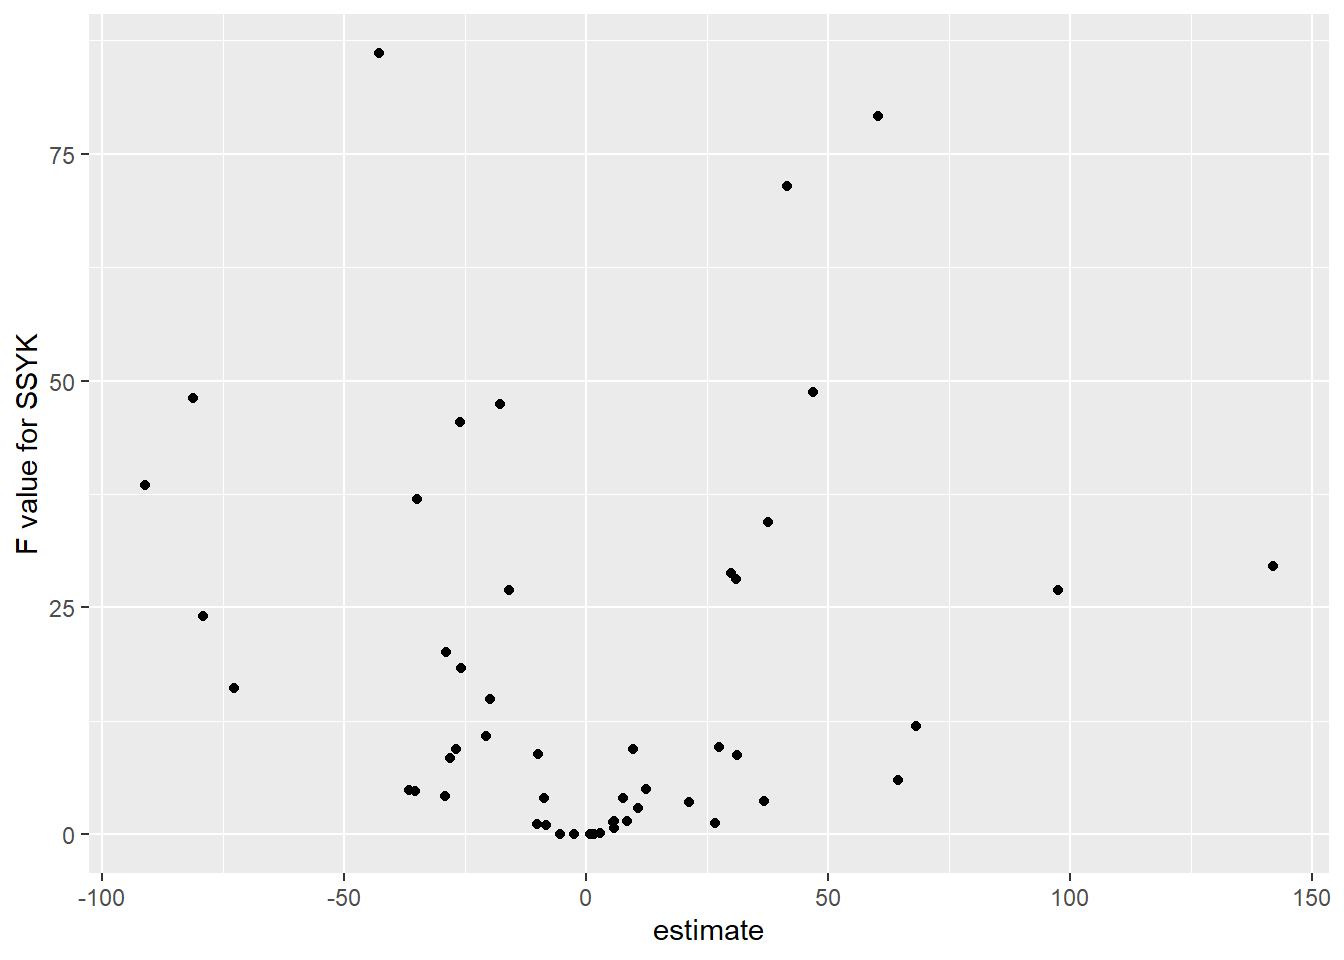
(#fig:ssyk14-18_12)Womens urbanization, comparison between the SSYK, Year 2014 - 2018, positive x = tendency for women within SSYK to migrate to regions with higher salaries, negative x = tendency for women within SSYK to migrate to regions with lower salaries
merge(summary_table, anova_table, by = "ssyk", all = TRUE) %>%
  filter (term.y == "log(salary.x)") %>%
  filter (term.x == "log(salary.x)") %>%
  select (ssyk, estimate, statistic.y) %>%
  arrange (desc (statistic.y)) %>%
  knitr::kable(
  booktabs = TRUE,
caption = 'Womens urbanization, comparison between the SSYK, Year 2014 - 2018') | ssyk | estimate | statistic.y |
|---|---|---|
| 241 Accountants, financial analysts and fund managers | -42.8934750 | 86.0593947 |
| 134 Architectural and engineering managers | 60.2961665 | 79.1276065 |
| 214 Engineering professionals | 41.4391605 | 71.4235616 |
| 141 Primary and secondary schools and adult education managers | 46.8489999 | 48.7867193 |
| 962 Newspaper distributors, janitors and other service workers | -81.1783974 | 48.0232518 |
| 234 Primary- and pre-school teachers | -17.8295506 | 47.3934455 |
| 242 Organisation analysts, policy administrators and human resource specialists | -26.1623709 | 45.3860211 |
| 441 Library and filing clerks | -91.1524715 | 38.4639599 |
| 411 Office assistants and other secretaries | -35.0529614 | 36.9454704 |
| 129 Administration and service managers not elsewhere classified | 37.6129265 | 34.3804780 |
| 232 Vocational education teachers | 141.7560302 | 29.5383924 |
| 332 Insurance advisers, sales and purchasing agents | 29.9895850 | 28.7795335 |
| 311 Physical and engineering science technicians | 30.9551484 | 28.0931343 |
| 213 Biologists, pharmacologists and specialists in agriculture and forestry | 97.5363529 | 26.9528526 |
| 331 Financial and accounting associate professionals | -15.9838334 | 26.9272578 |
| 541 Other surveillance and security workers | -79.1985728 | 24.0445092 |
| 262 Museum curators and librarians and related professionals | -28.8667633 | 20.0756006 |
| 261 Legal professionals | -25.9007200 | 18.2836308 |
| 532 Personal care workers in health services | -72.8339075 | 16.1279870 |
| 335 Tax and related government associate professionals | -19.8254572 | 14.8885361 |
| 534 Attendants, personal assistants and related workers | 68.1094133 | 11.9819561 |
| 333 Business services agents | -20.6701954 | 10.8426996 |
| 125 Sales and marketing managers | 27.4388500 | 9.6220304 |
| 221 Medical doctors | -27.0028420 | 9.4449119 |
| 222 Nursing professionals | 9.7234828 | 9.3956916 |
| 266 Social work and counselling professionals | -9.9189934 | 8.9062253 |
| 227 Naprapaths, physiotherapists, occupational therapists | 31.0932028 | 8.7061168 |
| 243 Marketing and public relations professionals | -28.1013433 | 8.3839999 |
| 341 Social work and religious associate professionals | 64.4583221 | 5.9648445 |
| 159 Other social services managers | 12.3012224 | 4.9830838 |
| 432 Stores and transport clerks | -36.5866571 | 4.8695284 |
| 224 Psychologists and psychotherapists | -35.4662944 | 4.7998447 |
| 231 University and higher education teachers | -29.2246040 | 4.2460382 |
| 336 Police officers | 7.5340282 | 3.9921676 |
| 151 Health care managers | -8.8085169 | 3.9532513 |
| 422 Client information clerks | 36.8198644 | 3.7283559 |
| 531 Child care workers and teachers aides | 21.2685621 | 3.5426735 |
| 218 Specialists within environmental and health protection | 10.7839688 | 2.9419753 |
| 153 Elderly care managers | 5.7154589 | 1.4929492 |
| 123 Administration and planning managers | 8.5155955 | 1.4830889 |
| 819 Process control technicians | 5.4915573 | 1.3159714 |
| 515 Building caretakers and related workers | 26.6623075 | 1.3077954 |
| 321 Medical and pharmaceutical technicians | -10.2383770 | 1.1683240 |
| 233 Secondary education teachers | -8.2149697 | 1.0646254 |
| 351 ICT operations and user support technicians | 5.6346559 | 0.7442968 |
| 251 ICT architects, systems analysts and test managers | 2.9326171 | 0.1852533 |
| 533 Health care assistants | -5.3262052 | 0.0939506 |
| 131 Information and communications technology service managers | 1.3365896 | 0.0579040 |
| 235 Teaching professionals not elsewhere classified | 1.5774773 | 0.0463449 |
| 223 Nursing professionals (cont.) | 0.7538617 | 0.0203265 |
| 911 Cleaners and helpers | -2.4446248 | 0.0009310 |
9.20 Salary correlation with population in region, comparison between the SSYK, Year 2003 - 2013
Average basic salary, monthly salary and women´s salary as a percentage of men´s salary by region, sector, occupational group (SSYK) and sex. Year 2003 - 2013 Number of employees All sectors
Monthly salary All sectors
tb <- readfile("AM0110A4_2.csv")

summary_table = 0
anova_table = 0
tb <- tb %>%
  group_by (`region`, year, `occupational group (SSYK)`) %>%
  mutate (perc_women = as.numeric (sub ("%", "", perc_women (salary)))) %>%
  group_by(region, year) %>%
  mutate(sum_pop = sum(salary))
tb <- readfile("AM0110A2_2.csv") %>%
  inner_join(tb, by = c("region", "year", "sex", "occupational group (SSYK)"))
for (i in unique(tb$`occupational group (SSYK)`)){
  temp <- filter(tb, `occupational group (SSYK)` == i)
  if (dim(temp)[1] > 25){
    model <- lm(log(salary.x) ~ sum_pop + year2.x + sex, data = temp)
    summary_table <- rbind (summary_table, mutate (mutate (tidy (summary (model)), ssyk = i)))
    anova_table <- rbind (anova_table, mutate (tidy (Anova (model, type = 2)), ssyk = i))
  }
}

merge(summary_table, anova_table, by = "ssyk", all = TRUE) %>%
  filter (term.y == "sum_pop") %>%
  filter (term.x == "sum_pop") %>%
  ggplot () +
    geom_point (mapping = aes(x = estimate, y = statistic.y)) +
    labs(
      x = "estimate",
      y = "F value for SSYK"
) 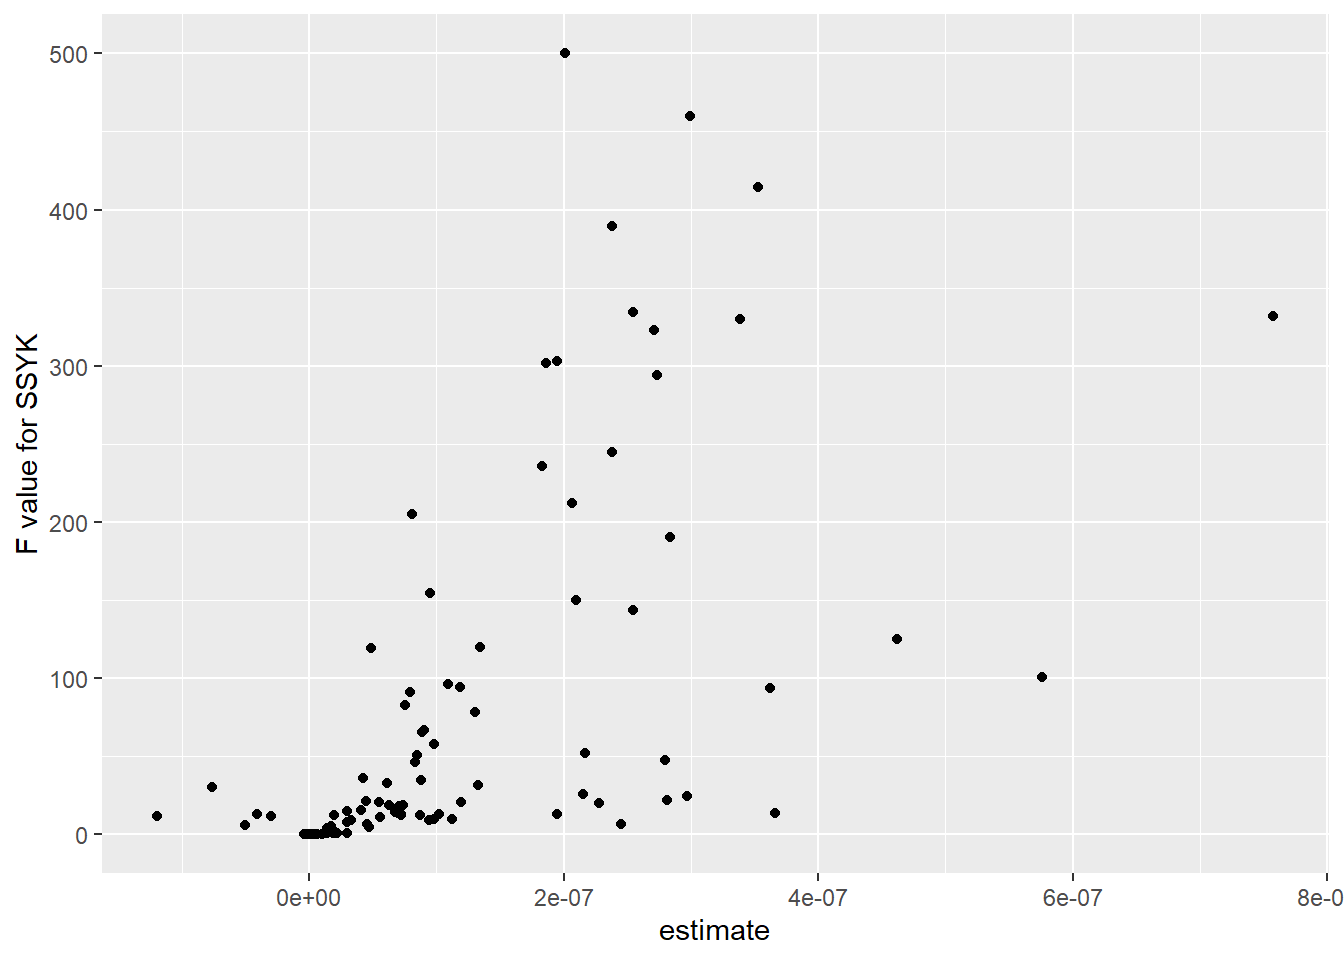
(#fig:ssyk14-18_13)Salary correlation with population in region, comparison between the SSYK, Year 2003 - 2013, positive x = regions with higher population have higher salaries, negative x = regions with higher population have lower salaries
merge(summary_table, anova_table, by = "ssyk", all = TRUE) %>%
  filter (term.y == "sum_pop") %>%
  filter (term.x == "sum_pop") %>%
  select (ssyk, estimate, statistic.y) %>%
  arrange (desc (statistic.y)) %>%
  knitr::kable(
  booktabs = TRUE,
caption = 'Salary correlation with population in region, comparison between the SSYK, Year 2003 - 2013') | ssyk | estimate | statistic.y |
|---|---|---|
| 311 Physical and engineering science technicians | 2e-07 | 500.1280127 |
| 341 Finance and sales associate professionals | 3e-07 | 460.0418364 |
| 123 Other specialist managers | 4e-07 | 414.5703277 |
| 122 Production and operations managers | 2e-07 | 389.7675125 |
| 213 Computing professionals | 3e-07 | 334.3595272 |
| 212 Mathematicians and statisticians | 8e-07 | 331.9425368 |
| 241 Business professionals | 3e-07 | 329.9047688 |
| 312 Computer associate professionals | 3e-07 | 322.6172830 |
| 247 Public service administrative professionals | 2e-07 | 303.0453641 |
| 345 Police officers and detectives | 2e-07 | 301.6616259 |
| 245 Writers and creative or performing artists | 3e-07 | 293.8813897 |
| 343 Administrative associate professionals | 2e-07 | 244.5345603 |
| 214 Architects, engineers and related professionals | 2e-07 | 235.5867367 |
| 411 Office secretaries and data entry operators | 2e-07 | 211.9374775 |
| 233 Primary education teaching professionals | 1e-07 | 205.1829239 |
| 242 Legal professionals | 3e-07 | 190.0943208 |
| 331 Pre-primary education teaching associate professionals | 1e-07 | 154.3615009 |
| 315 Safety and quality inspectors | 2e-07 | 149.7749605 |
| 131 Managers of small enterprises | 3e-07 | 143.4464401 |
| 111 Legislators and senior government officials | 5e-07 | 125.2831266 |
| 342 Business services agents and trade brokers | 1e-07 | 120.2728134 |
| 232 Secondary education teaching professionals | 0e+00 | 119.3366031 |
| 121 Directors and chief executives | 6e-07 | 100.7071794 |
| 713 Building finishers and related trades workers | 1e-07 | 96.3828334 |
| 419 Other office clerks | 1e-07 | 94.2589519 |
| 221 Life science professionals | 4e-07 | 93.4799243 |
| 323 Nursing associate professionals | 1e-07 | 91.3032534 |
| 322 Health associate professionals (except nursing) | 1e-07 | 83.0522375 |
| 235 Other teaching professionals | 1e-07 | 78.4718137 |
| 522 Shop and stall salespersons and demonstrators | 1e-07 | 67.0062003 |
| 243 Archivists, librarians and related information professionals | 1e-07 | 65.8178073 |
| 412 Numerical clerks | 1e-07 | 57.8108436 |
| 011 Armed forces | 2e-07 | 52.3164331 |
| 422 Client information clerks | 1e-07 | 50.7354313 |
| 248 Administrative professionals of special-interest organisations | 3e-07 | 47.6430798 |
| 414 Library and filing clerks | 1e-07 | 46.4721138 |
| 249 Psychologists, social work and related professionals | 0e+00 | 36.2728079 |
| 723 Machinery mechanics and fitters | 1e-07 | 34.9451359 |
| 919 Other sales and services elementary occupations | 1e-07 | 33.0869788 |
| 313 Optical and electronic equipment operators | 1e-07 | 31.7552441 |
| 246 Religious professionals | -1e-07 | 30.4865017 |
| 211 Physicists, chemists and related professionals | 2e-07 | 25.9210523 |
| 244 Social science and linguistics professionals (except social work professionals) | 3e-07 | 24.7634667 |
| 734 Craft printing and related trades workers | 3e-07 | 22.2407552 |
| 223 Nursing and midwifery professionals | 0e+00 | 21.2824918 |
| 821 Metal- and mineral-products machine operators | 1e-07 | 20.7296809 |
| 344 Customs, tax and related government associate professionals | 1e-07 | 20.5345482 |
| 347 Artistic, entertainment and sports associate professionals | 2e-07 | 20.3832956 |
| 712 Building frame and related trades workers | 1e-07 | 18.9127609 |
| 828 Assemblers | 1e-07 | 18.5999873 |
| 611 Market gardeners and crop growers | 1e-07 | 18.0628465 |
| 413 Stores and transport clerks | 0e+00 | 15.9149525 |
| 346 Social work associate professionals | 0e+00 | 14.8305597 |
| 827 Food and related products machine operators | 1e-07 | 14.0340683 |
| 314 Ship and aircraft controllers and technicians | 4e-07 | 13.9069035 |
| 824 Wood-products machine operators | 1e-07 | 13.6820134 |
| 511 Travel attendants and related workers | 2e-07 | 13.1825549 |
| 722 Blacksmiths, tool-makers and related trades workers | 1e-07 | 13.1654083 |
| 825 Printing-, binding- and paper-products machine operators | 1e-07 | 13.0839046 |
| 222 Health professionals (except nursing) | 0e+00 | 13.0042385 |
| 724 Electrical and electronic equipment mechanics and fitters | 1e-07 | 12.5063433 |
| 234 Special education teaching professionals | 0e+00 | 12.4239877 |
| 915 Garbage collectors and related labourers | 1e-07 | 12.2904717 |
| 913 Helpers in restaurants | 0e+00 | 11.9951185 |
| 833 Agricultural and other mobile-plant operators | -1e-07 | 11.6923549 |
| 816 Power-production and related plant operators | 1e-07 | 11.1704916 |
| 321 Agronomy and forestry technicians | 1e-07 | 10.0898363 |
| 815 Chemical-processing-plant operators | 1e-07 | 9.7664841 |
| 832 Motor-vehicle drivers | 0e+00 | 9.1253799 |
| 822 Chemical-products machine operators | 1e-07 | 9.0610781 |
| 512 Housekeeping and restaurant services workers | 0e+00 | 7.9019662 |
| 914 Doorkeepers, newspaper and package deliverers and related workers | 0e+00 | 6.8362319 |
| 711 Miners, shot firers, stonecutters and carvers | 2e-07 | 6.7158723 |
| 826 Textile-, fur- and leather-products machine operators | 0e+00 | 6.0247561 |
| 231 College, university and higher education teaching professionals | 0e+00 | 5.1251920 |
| 823 Rubber- and plastic-products machine operators | 0e+00 | 5.0401442 |
| 515 Protective services workers | 0e+00 | 3.8642344 |
| 324 Life science technicians | 0e+00 | 3.5543298 |
| 933 Transport labourers and freight handlers | 0e+00 | 1.1327310 |
| 421 Cashiers, tellers and related clerks | 0e+00 | 0.7926133 |
| 829 Other machine operators and assemblers | 0e+00 | 0.7630612 |
| 721 Metal moulders, welders, sheet-metal workers, structural-metal preparers and related trades workers | 0e+00 | 0.6870392 |
| 814 Wood-processing- and papermaking-plant operators | 0e+00 | 0.2763579 |
| 415 Mail carriers and sorting clerks | 0e+00 | 0.2720320 |
| 513 Personal care and related workers | 0e+00 | 0.2681019 |
| 831 Locomotive-engine drivers and related worker | 0e+00 | 0.1660888 |
| 912 Helpers and cleaners | 0e+00 | 0.1424455 |
| 514 Other personal services workers | 0e+00 | 0.0567542 |
| 812 Metal-processing-plant operators | 0e+00 | 0.0337384 |
| 932 Manufacturing labourers | 0e+00 | 0.0054044 |
| 731 Precision workers in metal and related materials | 0e+00 | 0.0009893 |
9.21 Salary correlation with population in region, comparison between the SSYK, Year 2014 - 2018
Average basic salary, monthly salary and women´s salary as a percentage of men´s salary by region, sector, occupational group (SSYK 2012) and sex . Year 2014 - 2018 Number of employees All sectors
Monthly salary All sectors
tb <- readfile("000000CD_13.csv")

summary_table = 0
anova_table = 0
tb <- tb %>%
  group_by (`region`, year, `occuptional  (SSYK 2012)`) %>%
  mutate (perc_women = as.numeric (sub ("%", "", perc_women (salary)))) %>%
  group_by(region, year) %>%
  mutate(sum_pop = sum(salary))
tb <- readfile("000000CG_3.csv") %>%
  inner_join(tb, by = c("region", "year", "sex", "occuptional  (SSYK 2012)"))
for (i in unique(tb$`occuptional  (SSYK 2012)`)){
  temp <- filter(tb, `occuptional  (SSYK 2012)` == i)
  if (dim(temp)[1] > 50){
    model <- lm(log(salary.x) ~ sum_pop + year2.x + sex, data = temp)
    summary_table <- rbind (summary_table, mutate (mutate (tidy (summary (model)), ssyk = i)))
    anova_table <- rbind (anova_table, mutate (tidy (Anova (model, type = 2)), ssyk = i))
  }
}

merge(summary_table, anova_table, by = "ssyk", all = TRUE) %>%
  filter (term.y == "sum_pop") %>%
  filter (term.x == "sum_pop") %>%
  ggplot () +
    geom_point (mapping = aes(x = estimate, y = statistic.y)) +
    labs(
      x = "estimate",
      y = "F value for SSYK"
) 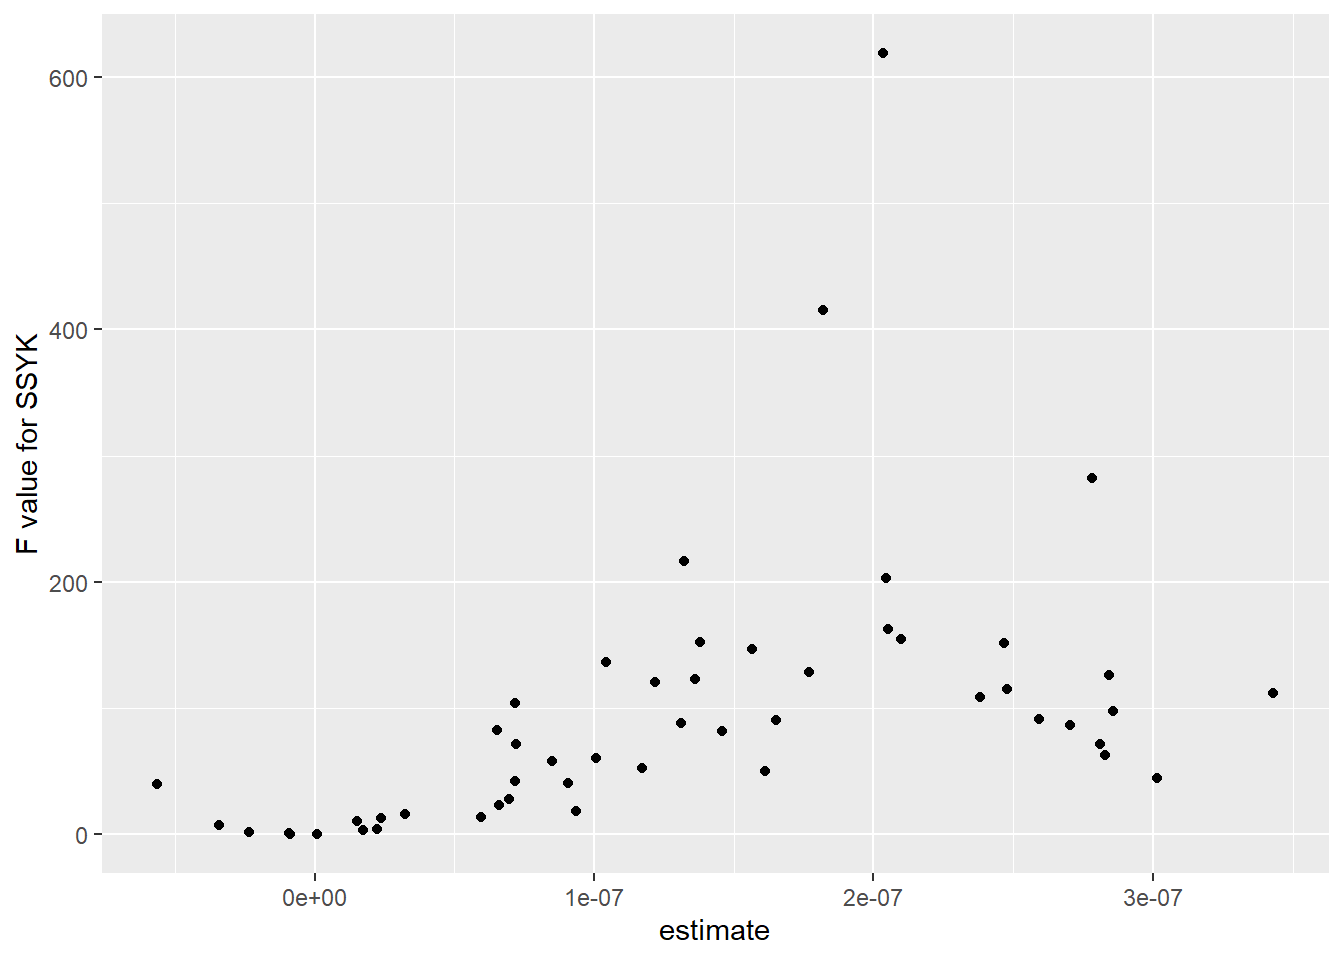
(#fig:ssyk14-18_14)Salary correlation with population in region, comparison between the SSYK, Year 2014 - 2018, positive x = regions with higher population have higher salaries, negative x = regions with higher population have lower salaries
merge(summary_table, anova_table, by = "ssyk", all = TRUE) %>%
  filter (term.y == "sum_pop") %>%
  filter (term.x == "sum_pop") %>%
  select (ssyk, estimate, statistic.y) %>%
  arrange (desc (statistic.y)) %>%
  knitr::kable(
  booktabs = TRUE,
caption = 'Salary correlation with population in region, comparison between the SSYK, Year 2014 - 2018') | ssyk | estimate | statistic.y |
|---|---|---|
| 335 Tax and related government associate professionals | 2e-07 | 618.9172956 |
| 153 Elderly care managers | 2e-07 | 415.5287723 |
| 242 Organisation analysts, policy administrators and human resource specialists | 3e-07 | 282.5442245 |
| 336 Police officers | 1e-07 | 216.4526824 |
| 159 Other social services managers | 2e-07 | 203.0228798 |
| 351 ICT operations and user support technicians | 2e-07 | 162.5763027 |
| 218 Specialists within environmental and health protection | 2e-07 | 154.8681586 |
| 234 Primary- and pre-school teachers | 1e-07 | 152.2797828 |
| 332 Insurance advisers, sales and purchasing agents | 2e-07 | 151.3033690 |
| 214 Engineering professionals | 2e-07 | 146.8224978 |
| 266 Social work and counselling professionals | 1e-07 | 136.5776762 |
| 251 ICT architects, systems analysts and test managers | 2e-07 | 128.5839528 |
| 241 Accountants, financial analysts and fund managers | 3e-07 | 126.0001648 |
| 141 Primary and secondary schools and adult education managers | 1e-07 | 122.8447285 |
| 411 Office assistants and other secretaries | 1e-07 | 120.7887691 |
| 333 Business services agents | 2e-07 | 115.2954418 |
| 331 Financial and accounting associate professionals | 3e-07 | 112.3529484 |
| 243 Marketing and public relations professionals | 2e-07 | 108.8218540 |
| 233 Secondary education teachers | 1e-07 | 104.2794021 |
| 123 Administration and planning managers | 3e-07 | 97.4300376 |
| 213 Biologists, pharmacologists and specialists in agriculture and forestry | 3e-07 | 91.1555373 |
| 134 Architectural and engineering managers | 2e-07 | 90.3221240 |
| 235 Teaching professionals not elsewhere classified | 1e-07 | 88.1257247 |
| 261 Legal professionals | 3e-07 | 86.7879979 |
| 533 Health care assistants | 1e-07 | 82.7513076 |
| 311 Physical and engineering science technicians | 1e-07 | 82.1150702 |
| 232 Vocational education teachers | 1e-07 | 71.5588956 |
| 129 Administration and service managers not elsewhere classified | 3e-07 | 71.4401227 |
| 131 Information and communications technology service managers | 3e-07 | 63.2871266 |
| 515 Building caretakers and related workers | 1e-07 | 60.2468588 |
| 223 Nursing professionals (cont.) | 1e-07 | 58.4436025 |
| 222 Nursing professionals | 1e-07 | 52.5801737 |
| 151 Health care managers | 2e-07 | 50.2968913 |
| 125 Sales and marketing managers | 3e-07 | 44.8688696 |
| 341 Social work and religious associate professionals | 1e-07 | 42.3565421 |
| 321 Medical and pharmaceutical technicians | 1e-07 | 40.9849447 |
| 231 University and higher education teachers | -1e-07 | 39.9354277 |
| 962 Newspaper distributors, janitors and other service workers | 1e-07 | 28.3745772 |
| 441 Library and filing clerks | 1e-07 | 22.9780940 |
| 262 Museum curators and librarians and related professionals | 1e-07 | 18.4452802 |
| 227 Naprapaths, physiotherapists, occupational therapists | 0e+00 | 15.8961515 |
| 422 Client information clerks | 1e-07 | 13.7996026 |
| 531 Child care workers and teachers aides | 0e+00 | 13.3373980 |
| 532 Personal care workers in health services | 0e+00 | 10.2753463 |
| 224 Psychologists and psychotherapists | 0e+00 | 7.2490748 |
| 432 Stores and transport clerks | 0e+00 | 4.1238055 |
| 541 Other surveillance and security workers | 0e+00 | 3.4769606 |
| 221 Medical doctors | 0e+00 | 1.8500601 |
| 911 Cleaners and helpers | 0e+00 | 0.8050857 |
| 819 Process control technicians | 0e+00 | 0.1724911 |
| 534 Attendants, personal assistants and related workers | 0e+00 | 0.0147750 |
9.22 Women with higher paid jobs migrate to regions with higher salaries, women with lower paid jobs migrate to regions with lower salaries, Year 2004 - 2013
Average basic salary, monthly salary and women´s salary as a percentage of men´s salary by sector, occupational group (SSYK) , sex and age. Year 2004 - 2013 Monthly salary All sectors
Average basic salary, monthly salary and women´s salary as a percentage of men´s salary by region, sector, occupational group (SSYK) and sex. Year 2003 - 2013 Number of employees All sectors
tb <- readfile("AM0110E2.csv") %>%
    rowwise() %>%
    mutate(age2 = unlist(lapply(strsplit(substr(age, 1, 5), "-"), strtoi))[1]) %>%
    rowwise() %>%
    mutate(age3 = unlist(lapply(strsplit(substr(age, 1, 5), "-"), strtoi))[2]) %>%
    mutate(age4 = (age3 + age2) / 2)

model <- lm (log(salary) ~ `occupational group (SSYK)` + year2 + sex + poly(age4, 3), data = tb)

salary_table <- tidy (summary (model)) %>%
  mutate (ssyk = gsub("`occupational group \\(SSYK\\)`", "", term))

tb <- readfile("AM0110A4_2.csv")

summary_table = 0
anova_table = 0
tb <- tb %>%
    group_by (`region`, year, `occupational group (SSYK)`) %>%
    mutate (perc_women = as.numeric (sub ("%", "", perc_women (salary)))) %>%
    group_by(region, year) %>%
    mutate(sum_pop = sum(salary))
tb <- readfile("AM0110A2_2.csv") %>%
    inner_join(tb, by = c("region", "year", "sex", "occupational group (SSYK)"))
for (i in unique(tb$`occupational group (SSYK)`)){
    temp <- filter(tb, `occupational group (SSYK)` == i)
    if (dim(temp)[1] > 50){
        model <- lm(perc_women ~ log(salary.x) + year2.x + sex, data = temp)
        summary_table <- rbind (summary_table, mutate (mutate (tidy (summary (model)), ssyk = i)))
        anova_table <- rbind (anova_table, mutate (tidy (Anova (model, type = 2)), ssyk = i))
    }
}
## Note: model has aliased coefficients
## sums of squares computed by model comparisonsumtab <- merge(salary_table, anova_table, by = "ssyk", all = TRUE)
merge(summary_table, sumtab, by = "ssyk", all = TRUE) %>%
filter (term.y == "log(salary.x)") %>%
filter (term == "log(salary.x)") %>%
filter (statistic.y > 35) %>% # Filter noice with low relevance
ggscatter(x = "estimate.x", y = "estimate.y",
add = "reg.line", conf.int = TRUE,
cor.coef = TRUE, cor.method = "pearson") +
labs(
x = "estimate for women urbanization",
y = "estimate for SSYK salaries"
) 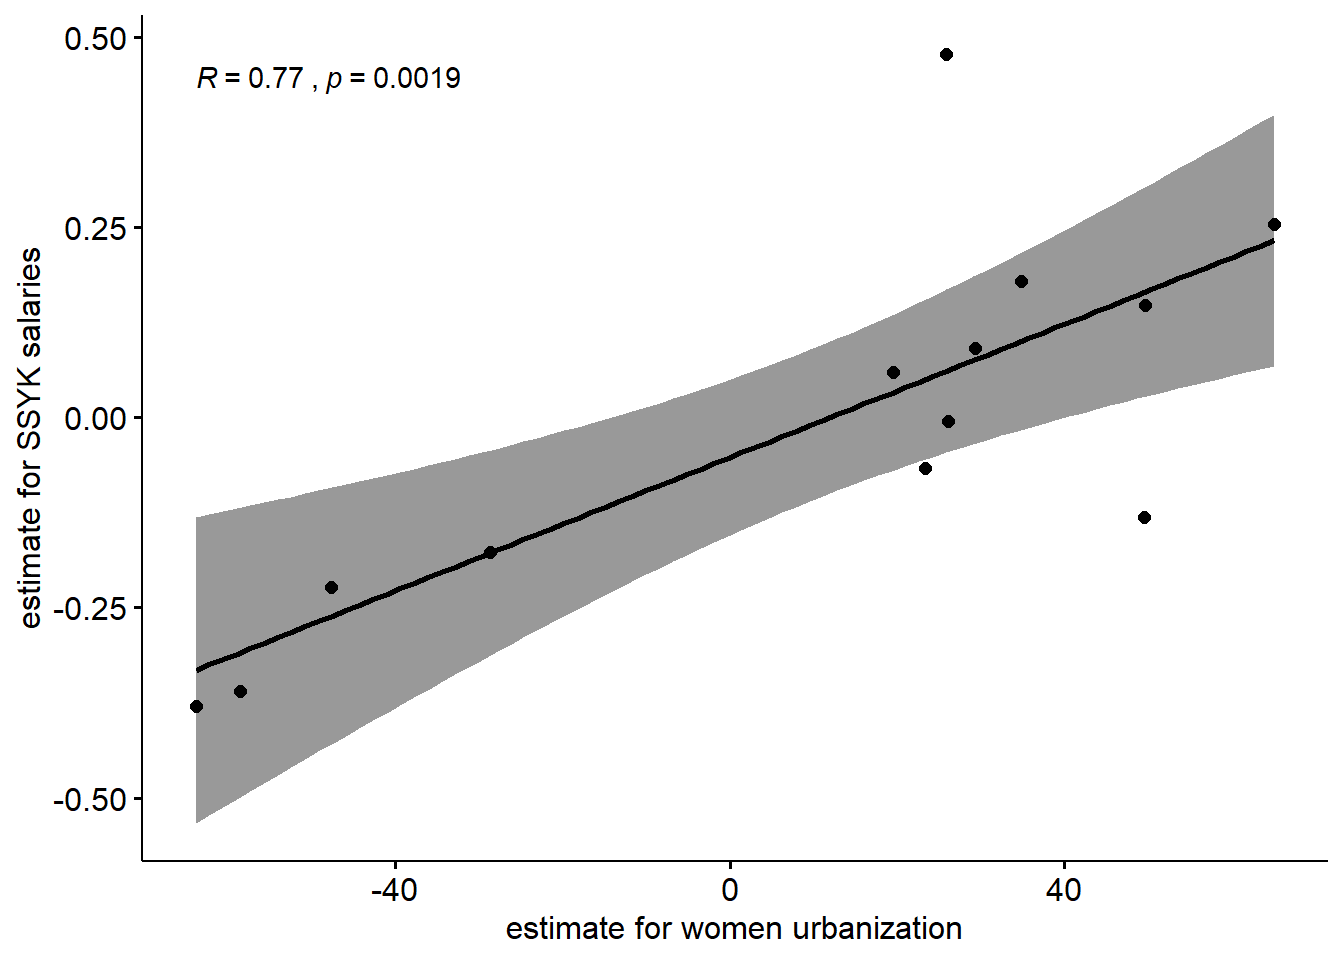
(#fig:ssyk14-18_15)Women with higher paid jobs migrate to regions with higher salaries, women with lower paid jobs migrate to regions with lower salaries, positive x = tendency for women within SSYK to migrate to regions with higher salaries, positive y = SSYK with higher salaries than average for all SSYK
merge(summary_table, sumtab, by = "ssyk", all = TRUE) %>%
  filter (term.y == "log(salary.x)") %>%
  filter (term == "log(salary.x)") %>%
  filter (statistic.y > 35)  %>%  # Filter noice with low relevance
  select (ssyk, estimate.x, estimate.y) %>%
  arrange (desc (estimate.x)) %>%
  knitr::kable(
  booktabs = TRUE,
caption = 'Women with higher paid jobs migrate to regions with higher salaries, women with lower paid jobs migrate to regions with lower salaries') | ssyk | estimate.x | estimate.y |
|---|---|---|
| 211 Physicists, chemists and related professionals | 65.02898 | 0.2541572 |
| 221 Life science professionals | 49.61063 | 0.1475151 |
| 232 Secondary education teaching professionals | 49.52621 | -0.1317355 |
| 214 Architects, engineers and related professionals | 34.79997 | 0.1784295 |
| 131 Managers of small enterprises | 29.35080 | 0.0906872 |
| 311 Physical and engineering science technicians | 26.11635 | -0.0053539 |
| 123 Other specialist managers | 25.87871 | 0.4774895 |
| 345 Police officers and detectives | 23.36843 | -0.0668591 |
| 341 Finance and sales associate professionals | 19.56942 | 0.0591795 |
| 412 Numerical clerks | -28.71290 | -0.1771011 |
| 411 Office secretaries and data entry operators | -47.63148 | -0.2233204 |
| 414 Library and filing clerks | -58.58786 | -0.3598463 |
| 919 Other sales and services elementary occupations | -63.85488 | -0.3792034 |
9.23 Women with higher paid jobs migrate to regions with higher salaries, women with lower paid jobs migrate to regions with lower salaries, Year 2014 - 2018
Average basic salary, monthly salary and women´s salary as a percentage of men´s salary by sector, occupational group (SSYK 2012) , sex and age. Year 2014 - 2018 Monthly salary All sectors
Average basic salary, monthly salary and women´s salary as a percentage of men´s salary by region, sector, occupational group (SSYK 2012) and sex . Year 2014 - 2018 Number of employees All sectors
tb <- readfile("000000D2_1.csv") %>%
    rowwise() %>%
    mutate(age2 = unlist(lapply(strsplit(substr(age, 1, 5), "-"), strtoi))[1]) %>%
    rowwise() %>%
    mutate(age3 = unlist(lapply(strsplit(substr(age, 1, 5), "-"), strtoi))[2]) %>%
    mutate(age4 = (age3 + age2) / 2)

model <- lm (log(salary) ~ `occuptional  (SSYK 2012)` + year2 + sex + poly(age4, 3), data = tb)

salary_table <- tidy (summary (model)) %>%
  mutate (ssyk = gsub("`occuptional  \\(SSYK 2012\\)`", "", term))

tb <- readfile("000000CD_13.csv")

summary_table = 0
anova_table = 0
tb <- tb %>%
    group_by (`region`, year, `occuptional  (SSYK 2012)`) %>%
    mutate (perc_women = as.numeric (sub ("%", "", perc_women (salary)))) %>%
    group_by(region, year) %>%
    mutate(sum_pop = sum(salary))
tb <- readfile("000000CG_3.csv") %>%
    inner_join(tb, by = c("region", "year", "sex", "occuptional  (SSYK 2012)"))
for (i in unique(tb$`occuptional  (SSYK 2012)`)){
    temp <- filter(tb, `occuptional  (SSYK 2012)` == i)
    if (dim(temp)[1] > 50){
        model <- lm(perc_women ~ log(salary.x) + year2.x + sex, data = temp)
        summary_table <- rbind (summary_table, mutate (mutate (tidy (summary (model)), ssyk = i)))
        anova_table <- rbind (anova_table, mutate (tidy (Anova (model, type = 2)), ssyk = i))
    }
}

sumtab <- merge(salary_table, anova_table, by = "ssyk", all = TRUE)
merge(summary_table, sumtab, by = "ssyk", all = TRUE) %>%
  filter (term.y == "log(salary.x)") %>%
  filter (term == "log(salary.x)") %>%
  filter (statistic.y > 15)  %>%  # Filter noice with low relevance
  ggscatter(x = "estimate.x", y = "estimate.y",
  add = "reg.line", conf.int = TRUE,
  cor.coef = TRUE, cor.method = "pearson") +
  labs(
    x = "estimate for women urbanization",
    y = "estimate for SSYK salaries"
) 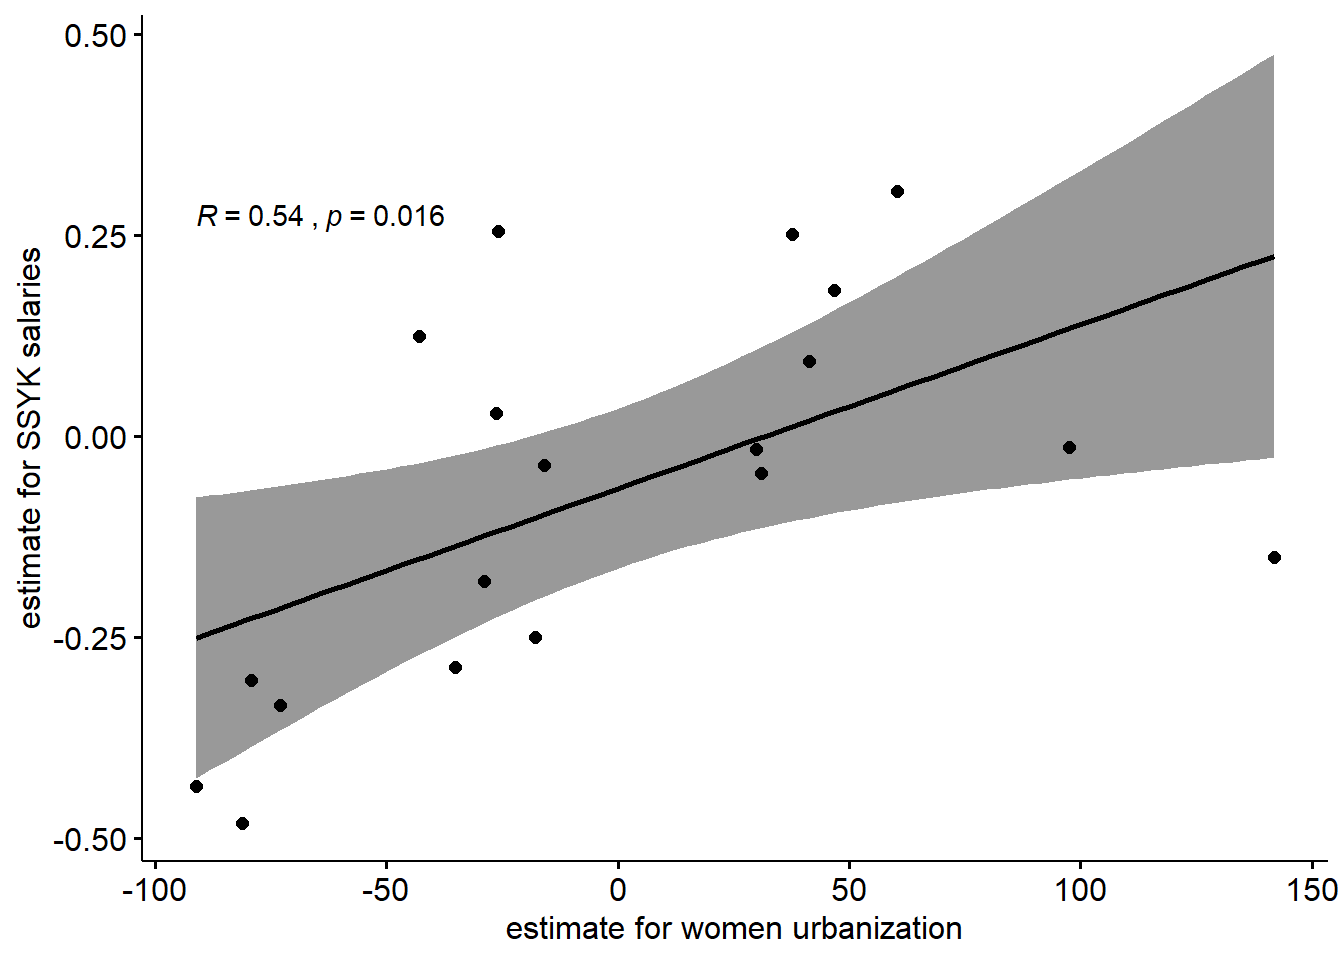
(#fig:ssyk14-18_16)Women with higher paid jobs migrate to regions with higher salaries, women with lower paid jobs migrate to regions with lower salaries, positive x = tendency for women within SSYK to migrate to regions with higher salaries, positive y = SSYK with higher salaries than average for all SSYK
merge(summary_table, sumtab, by = "ssyk", all = TRUE) %>%
  filter (term.y == "log(salary.x)") %>%
  filter (term == "log(salary.x)") %>%
  filter (statistic.y > 15)  %>%  # Filter noice with low relevance
  select (ssyk, estimate.x, estimate.y) %>%
  arrange (desc (estimate.x)) %>%
  knitr::kable(
  booktabs = TRUE,
caption = 'Women with higher paid jobs migrate to regions with higher salaries, women with lower paid jobs migrate to regions with lower salaries') | ssyk | estimate.x | estimate.y |
|---|---|---|
| 232 Vocational education teachers | 141.75603 | -0.1505542 |
| 213 Biologists, pharmacologists and specialists in agriculture and forestry | 97.53635 | -0.0126828 |
| 134 Architectural and engineering managers | 60.29617 | 0.3047370 |
| 141 Primary and secondary schools and adult education managers | 46.84900 | 0.1827212 |
| 214 Engineering professionals | 41.43916 | 0.0932335 |
| 129 Administration and service managers not elsewhere classified | 37.61293 | 0.2519280 |
| 311 Physical and engineering science technicians | 30.95515 | -0.0457919 |
| 332 Insurance advisers, sales and purchasing agents | 29.98959 | -0.0151998 |
| 331 Financial and accounting associate professionals | -15.98383 | -0.0353587 |
| 234 Primary- and pre-school teachers | -17.82955 | -0.2498722 |
| 261 Legal professionals | -25.90072 | 0.2555572 |
| 242 Organisation analysts, policy administrators and human resource specialists | -26.16237 | 0.0290522 |
| 262 Museum curators and librarians and related professionals | -28.86676 | -0.1797104 |
| 411 Office assistants and other secretaries | -35.05296 | -0.2861178 |
| 241 Accountants, financial analysts and fund managers | -42.89348 | 0.1243897 |
| 532 Personal care workers in health services | -72.83391 | -0.3338730 |
| 541 Other surveillance and security workers | -79.19857 | -0.3033981 |
| 962 Newspaper distributors, janitors and other service workers | -81.17840 | -0.4804970 |
| 441 Library and filing clerks | -91.15247 | -0.4352854 |
9.24 The correlation between salary level and the F-value for age, Year 2004 - 2013
Average basic salary, monthly salary and women´s salary as a percentage of men´s salary by sector, occupational group (SSYK) , sex and age. Year 2004 - 2013 Monthly salary All sectors
tb <- readfile("AM0110E2.csv") %>%
    rowwise() %>%
    mutate(age2 = unlist(lapply(strsplit(substr(age, 1, 5), "-"), strtoi))[1]) %>%
    rowwise() %>%
    mutate(age3 = unlist(lapply(strsplit(substr(age, 1, 5), "-"), strtoi))[2]) %>%
    mutate(age4 = (age3 + age2) / 2)
model <- lm (log(salary) ~ `occupational group (SSYK)` + year2 + sex + poly(age4, 3), data = tb)
salary_table <- tidy (summary (model)) %>%
  mutate (ssyk = gsub("`occupational group \\(SSYK\\)`", "", term))

summary_table = 0
anova_table = 0
for (i in unique(tb$`occupational group (SSYK)`)){
  temp <- filter(tb, `occupational group (SSYK)` == i)
  if (dim(temp)[1] > 50){
    model <- lm (log(salary) ~ year2 + sex + poly(age4, 3), data = temp)
    summary_table <- rbind (summary_table, mutate (mutate (tidy (summary (model)), ssyk = i), spannvidd = max (filter (temp, year2 == 2013)$salary) / min (filter (temp, year2 == 2013)$salary)))
    anova_table <- rbind (anova_table, mutate (tidy (Anova (model, type = 2)), ssyk = i))
  }
}

sumtab <- merge(salary_table, anova_table, by = "ssyk", all = TRUE)
sumtab <- merge(summary_table, sumtab, by = "ssyk", all = TRUE)
sumtab %>%
  filter (term.y == "poly(age4, 3)") %>%
  filter (term == "year2") %>%
  ggscatter(x = "estimate.y", y = "statistic.y",
  add = "reg.line", conf.int = TRUE,
  cor.coef = TRUE, cor.method = "pearson") +
  labs(
    x = "Salary level",
    y = "F-value for age"
  )
## Warning: Removed 1 rows containing non-finite values (stat_smooth).## Warning: Removed 1 rows containing non-finite values (stat_cor).## Warning: Removed 1 rows containing missing values (geom_point).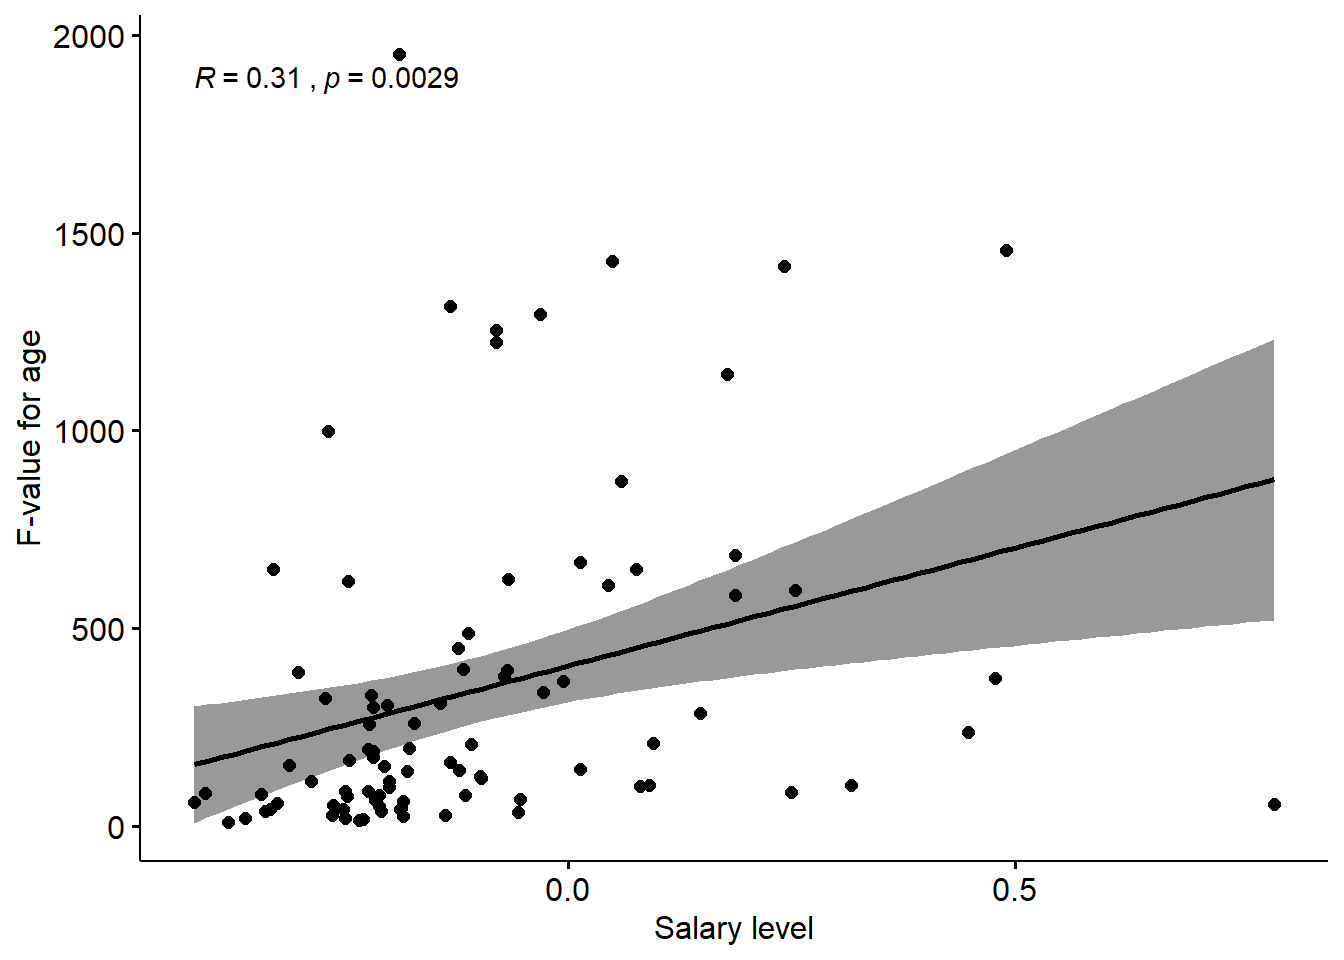
(#fig:ssyk14-18_17)The correlation between salary level and the F-value for age
sumtab %>%
  filter (term.y == "poly(age4, 3)") %>%
  filter (term == "year2") %>%
  select (ssyk, estimate.y, statistic.y) %>%
  arrange (desc (statistic.y)) %>%
  knitr::kable(
  booktabs = TRUE,
caption = 'The correlation between salary level and the F-value for age') | ssyk | estimate.y | statistic.y |
|---|---|---|
| 233 Primary education teaching professionals | -0.1878374 | 1951.69188 |
| 222 Health professionals (except nursing) | 0.4890067 | 1457.04286 |
| 231 College, university and higher education teaching professionals | 0.0496420 | 1427.63618 |
| 122 Production and operations managers | 0.2414125 | 1416.37235 |
| 232 Secondary education teaching professionals | -0.1317355 | 1315.72047 |
| 312 Computer associate professionals | -0.0305085 | 1293.59017 |
| 323 Nursing associate professionals | -0.0803320 | 1253.47223 |
| 249 Psychologists, social work and related professionals | -0.0794669 | 1224.76753 |
| 214 Architects, engineers and related professionals | 0.1784295 | 1142.58491 |
| 331 Pre-primary education teaching associate professionals | -0.2677866 | 999.04369 |
| 341 Finance and sales associate professionals | 0.0591795 | 871.24552 |
| 011 Armed forces | NA | 842.31457 |
| 213 Computing professionals | 0.1869678 | 684.64507 |
| 247 Public service administrative professionals | 0.0143360 | 668.36080 |
| 415 Mail carriers and sorting clerks | -0.3291254 | 649.49005 |
| 246 Religious professionals | 0.0763499 | 649.17379 |
| 345 Police officers and detectives | -0.0668591 | 625.49516 |
| 346 Social work associate professionals | -0.2451915 | 620.00016 |
| 245 Writers and creative or performing artists | 0.0455956 | 609.58554 |
| 211 Physicists, chemists and related professionals | 0.2541572 | 597.42679 |
| 241 Business professionals | 0.1864641 | 585.28238 |
| 322 Health associate professionals (except nursing) | -0.1112299 | 488.16340 |
| 235 Other teaching professionals | -0.1224089 | 450.42722 |
| 234 Special education teaching professionals | -0.1168014 | 396.46505 |
| 343 Administrative associate professionals | -0.0679140 | 395.88113 |
| 513 Personal care and related workers | -0.3008597 | 390.16452 |
| 815 Chemical-processing-plant operators | -0.0707002 | 379.39618 |
| 123 Other specialist managers | 0.4774895 | 374.21391 |
| 311 Physical and engineering science technicians | -0.0053539 | 365.90476 |
| 223 Nursing and midwifery professionals | -0.0277232 | 338.30668 |
| 515 Protective services workers | -0.2196469 | 330.90303 |
| 422 Client information clerks | -0.2710249 | 322.90797 |
| 243 Archivists, librarians and related information professionals | -0.1430274 | 312.02627 |
| 822 Chemical-products machine operators | -0.2021040 | 305.02965 |
| 419 Other office clerks | -0.2169749 | 300.21773 |
| 221 Life science professionals | 0.1475151 | 286.98782 |
| 324 Life science technicians | -0.1718150 | 261.87836 |
| 413 Stores and transport clerks | -0.2212557 | 256.92774 |
| 314 Ship and aircraft controllers and technicians | 0.4473610 | 237.48869 |
| 244 Social science and linguistics professionals (except social work professionals) | 0.0949958 | 210.55221 |
| 342 Business services agents and trade brokers | -0.1074352 | 207.12314 |
| 412 Numerical clerks | -0.1771011 | 196.86360 |
| 411 Office secretaries and data entry operators | -0.2233204 | 193.76835 |
| 829 Other machine operators and assemblers | -0.2175313 | 190.23514 |
| 721 Metal moulders, welders, sheet-metal workers, structural-metal preparers and related trades workers | -0.2170469 | 175.49681 |
| 823 Rubber- and plastic-products machine operators | -0.2435825 | 167.38463 |
| 313 Optical and electronic equipment operators | -0.1316074 | 162.50630 |
| 512 Housekeeping and restaurant services workers | -0.3106191 | 153.68491 |
| 722 Blacksmiths, tool-makers and related trades workers | -0.2051246 | 151.47248 |
| 315 Safety and quality inspectors | 0.0141641 | 145.56840 |
| 511 Travel attendants and related workers | -0.1208602 | 140.94823 |
| 344 Customs, tax and related government associate professionals | -0.1791629 | 140.50202 |
| 347 Artistic, entertainment and sports associate professionals | -0.0976138 | 126.91226 |
| 814 Wood-processing- and papermaking-plant operators | -0.0965608 | 122.20339 |
| 932 Manufacturing labourers | -0.2869549 | 113.71684 |
| 825 Printing-, binding- and paper-products machine operators | -0.1993668 | 113.27582 |
| 131 Managers of small enterprises | 0.0906872 | 104.47801 |
| 242 Legal professionals | 0.3163374 | 103.25042 |
| 248 Administrative professionals of special-interest organisations | 0.0806722 | 102.09489 |
| 723 Machinery mechanics and fitters | -0.1994452 | 97.76839 |
| 714 Painters, building structure cleaners and related trades workers | -0.2225634 | 89.43137 |
| 713 Building finishers and related trades workers | -0.2487094 | 88.76996 |
| 212 Mathematicians and statisticians | 0.2495026 | 87.18638 |
| 912 Helpers and cleaners | -0.4049861 | 84.83107 |
| 611 Market gardeners and crop growers | -0.3419262 | 82.14254 |
| 821 Metal- and mineral-products machine operators | -0.2103411 | 79.50551 |
| 812 Metal-processing-plant operators | -0.1144630 | 77.88761 |
| 828 Assemblers | -0.2463128 | 77.38124 |
| 831 Locomotive-engine drivers and related worker | -0.0533469 | 68.37296 |
| 734 Craft printing and related trades workers | -0.2145231 | 66.46350 |
| 724 Electrical and electronic equipment mechanics and fitters | -0.1837737 | 64.27696 |
| 913 Helpers in restaurants | -0.4174033 | 60.46244 |
| 914 Doorkeepers, newspaper and package deliverers and related workers | -0.3245340 | 58.60471 |
| 121 Directors and chief executives | 0.7881691 | 55.09215 |
| 514 Other personal services workers | -0.2621824 | 52.59568 |
| 833 Agricultural and other mobile-plant operators | -0.2109833 | 51.72220 |
| 933 Transport labourers and freight handlers | -0.1857803 | 46.02971 |
| 826 Textile-, fur- and leather-products machine operators | -0.3318789 | 43.06312 |
| 824 Wood-products machine operators | -0.2506177 | 42.56020 |
| 332 Other teaching associate professionals | -0.1867732 | 42.34720 |
| 612 Animal producers and related workers | -0.3383252 | 39.10006 |
| 522 Shop and stall salespersons and demonstrators | -0.2085389 | 38.81291 |
| 321 Agronomy and forestry technicians | -0.0555436 | 37.04074 |
| 915 Garbage collectors and related labourers | -0.2630712 | 29.19059 |
| 816 Power-production and related plant operators | -0.1368992 | 27.65173 |
| 712 Building frame and related trades workers | -0.1834122 | 24.53035 |
| 414 Library and filing clerks | -0.3598463 | 20.67900 |
| 832 Motor-vehicle drivers | -0.2490619 | 20.31541 |
| 827 Food and related products machine operators | -0.2285315 | 19.18984 |
| 421 Cashiers, tellers and related clerks | -0.2324445 | 15.24343 |
| 919 Other sales and services elementary occupations | -0.3792034 | 10.27841 |
9.25 The correlation between salary level and the F-value for age, Year 2014 - 2018
Average basic salary, monthly salary and women´s salary as a percentage of men´s salary by sector, occupational group (SSYK 2012) , sex and age. Year 2014 - 2018 Monthly salary All sectors
tb <- readfile("000000D2_1.csv") %>%
    rowwise() %>%
    mutate(age2 = unlist(lapply(strsplit(substr(age, 1, 5), "-"), strtoi))[1]) %>%
    rowwise() %>%
    mutate(age3 = unlist(lapply(strsplit(substr(age, 1, 5), "-"), strtoi))[2]) %>%
    mutate(age4 = (age3 + age2) / 2)
model <- lm (log(salary) ~ `occuptional  (SSYK 2012)` + year2 + sex + poly(age4, 3), data = tb)
salary_table <- tidy (summary (model)) %>%
  mutate (ssyk = gsub("`occuptional  \\(SSYK 2012\\)`", "", term))

tb <- readfile("000000D2_1.csv") %>%
  rowwise() %>%
  mutate(age2 = unlist(lapply(strsplit(substr(age, 1, 5), "-"), strtoi))[1]) %>%
  rowwise() %>%
  mutate(age3 = unlist(lapply(strsplit(substr(age, 1, 5), "-"), strtoi))[2]) %>%
  mutate(age4 = (age3 + age2) / 2)

summary_table = 0
anova_table = 0
for (i in unique(tb$`occuptional  (SSYK 2012)`)){
  temp <- filter(tb, `occuptional  (SSYK 2012)` == i)
  if (dim(temp)[1] > 50){
    model <- lm (log(salary) ~ year2 + sex + poly(age4, 3), data = temp)
    summary_table <- rbind (summary_table, mutate (mutate (tidy (summary (model)), ssyk = i), spannvidd = max (filter (temp, year2 == 2018)$salary) / min (filter (temp, year2 == 2018)$salary)))
    anova_table <- rbind (anova_table, mutate (tidy (Anova (model, type = 2)), ssyk = i))
  }
}

sumtab <- merge(salary_table, anova_table, by = "ssyk", all = TRUE)
sumtab <- merge(summary_table, sumtab, by = "ssyk", all = TRUE)
sumtab %>%
  filter (term.y == "poly(age4, 3)") %>%
  filter (term == "year2") %>%
  ggscatter(x = "estimate.y", y = "statistic.y",
  add = "reg.line", conf.int = TRUE,
  cor.coef = TRUE, cor.method = "pearson") +
  labs(
    x = "Salary level",
    y = "F-value for age"
) 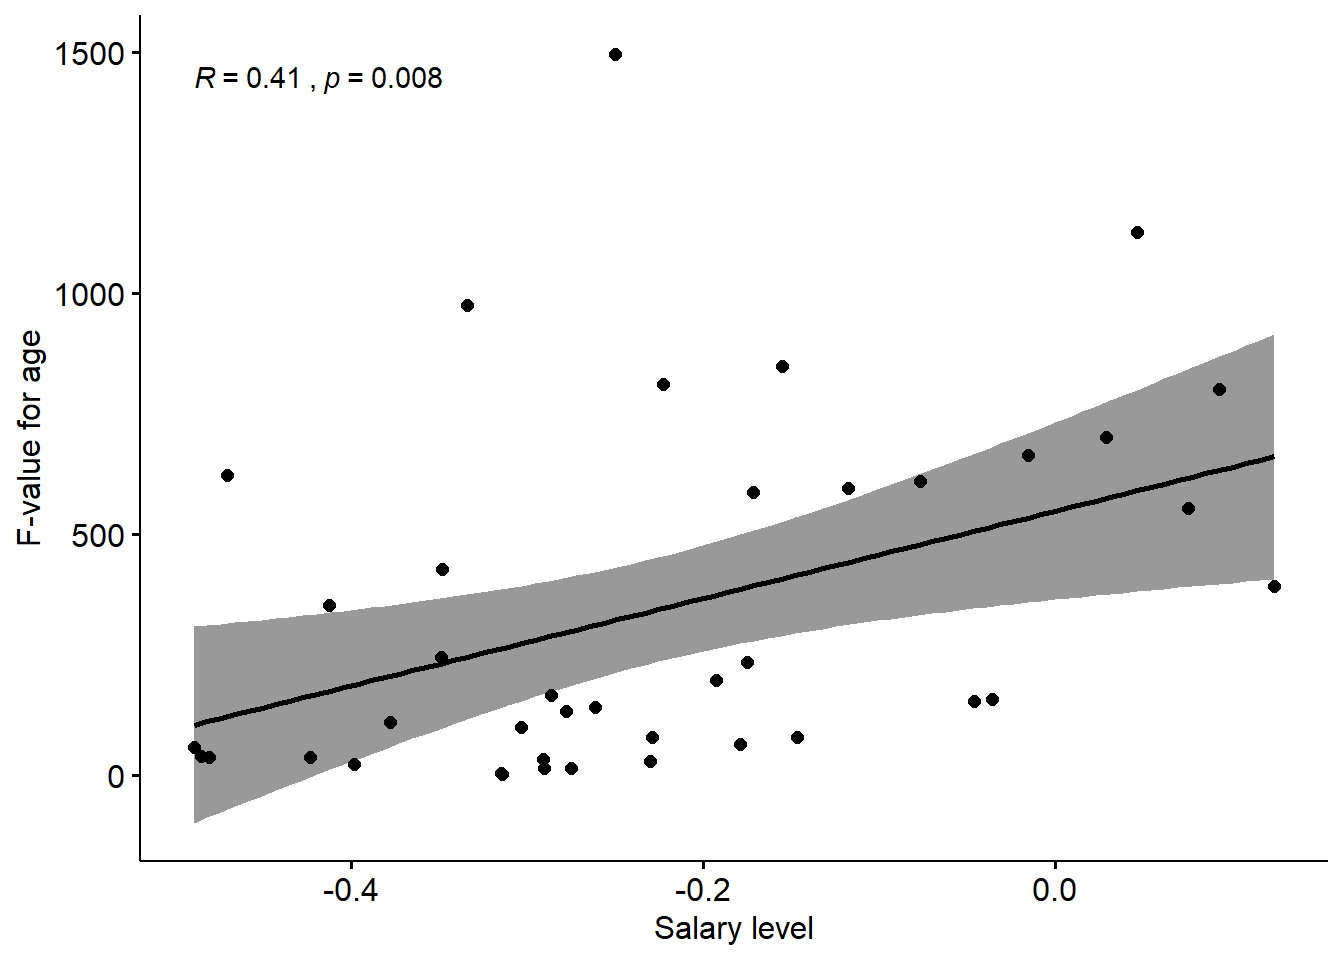
(#fig:ssyk14-18_18)The correlation between salary level and the F-value for age
sumtab %>%
  filter (term.y == "poly(age4, 3)") %>%
  filter (term == "year2") %>%
  select (ssyk, estimate.y, statistic.y) %>%
  arrange (desc (statistic.y)) %>%
  knitr::kable(
  booktabs = TRUE,
caption = 'The correlation between salary level and the F-value for age') | ssyk | estimate.y | statistic.y |
|---|---|---|
| 234 Primary- and pre-school teachers | -0.2498722 | 1496.606988 |
| 231 University and higher education teachers | 0.0465586 | 1127.841359 |
| 532 Personal care workers in health services | -0.3338730 | 975.453302 |
| 233 Secondary education teachers | -0.1547118 | 849.896621 |
| 235 Teaching professionals not elsewhere classified | -0.2224782 | 812.791078 |
| 214 Engineering professionals | 0.0932335 | 801.889286 |
| 242 Organisation analysts, policy administrators and human resource specialists | 0.0290522 | 701.614565 |
| 332 Insurance advisers, sales and purchasing agents | -0.0151998 | 664.442254 |
| 531 Child care workers and teachers aides | -0.4701506 | 622.684596 |
| 222 Nursing professionals | -0.0764471 | 611.433214 |
| 351 ICT operations and user support technicians | -0.1173323 | 596.249682 |
| 266 Social work and counselling professionals | -0.1714779 | 587.044065 |
| 251 ICT architects, systems analysts and test managers | 0.0754768 | 555.431565 |
| 534 Attendants, personal assistants and related workers | -0.3479774 | 428.571695 |
| 241 Accountants, financial analysts and fund managers | 0.1243897 | 391.870288 |
| 533 Health care assistants | -0.4125681 | 352.960310 |
| 422 Client information clerks | -0.3486152 | 245.488178 |
| 321 Medical and pharmaceutical technicians | -0.1748708 | 236.191372 |
| 335 Tax and related government associate professionals | -0.1926555 | 198.582732 |
| 411 Office assistants and other secretaries | -0.2861178 | 166.766194 |
| 331 Financial and accounting associate professionals | -0.0353587 | 158.923954 |
| 311 Physical and engineering science technicians | -0.0457919 | 154.667997 |
| 723 Machinery mechanics and fitters | -0.2614374 | 142.874499 |
| 341 Social work and religious associate professionals | -0.2778739 | 134.606247 |
| 515 Building caretakers and related workers | -0.3779723 | 111.384579 |
| 541 Other surveillance and security workers | -0.3033981 | 99.793943 |
| 333 Business services agents | -0.1463022 | 80.618256 |
| 227 Naprapaths, physiotherapists, occupational therapists | -0.2289576 | 80.052441 |
| 819 Process control technicians | -0.1789066 | 65.100656 |
| 911 Cleaners and helpers | -0.4893229 | 58.927493 |
| 941 Fast-food workers, food preparation assistants | -0.4850005 | 40.150153 |
| 962 Newspaper distributors, janitors and other service workers | -0.4804970 | 39.069854 |
| 611 Market gardeners and crop growers | -0.4232930 | 37.208581 |
| 432 Stores and transport clerks | -0.2908432 | 33.903777 |
| 834 Mobile plant operators | -0.2298379 | 29.791104 |
| 512 Cooks and cold-buffet managers | -0.3980305 | 22.750271 |
| 722 Blacksmiths, toolmakers and related trades workers | -0.2900944 | 14.874887 |
| 522 Shop staff | -0.2750987 | 14.735285 |
| 833 Heavy truck and bus drivers | -0.3147488 | 4.531345 |
| 821 Assemblers | -0.3142495 | 2.226122 |
9.26 Animations , SSYK 214, Architects, engineers and related professionals
Approximaton with B-spline
Average monthly pay (total pay), non-manual workers private sector (SLP),
SEK by occuptional group (SSYK), age, sex and year 2000-2013
214 Engineering professionals
sex=total
readfile("AM0103A9.csv") %>% rowwise() %>% mutate(age2 = unlist(lapply(strsplit(substr(age, 1, 5), "-"), strtoi))[1]) %>%
rowwise() %>% mutate(age3 = unlist(lapply(strsplit(substr(age, 1, 5), "-"), strtoi))[2]) %>%
 ggplot(mapping = aes(x = year2 - (age2 + age3) / 2, y = salary)) +
   geom_point() +
   geom_smooth(method = lm, formula = y ~ splines::bs(x, 8), se = FALSE) +
   transition_time(year2) +
   labs(title = "Year: {frame_time}") +
    scale_x_continuous(name = "Year of birth") +
   scale_y_continuous(name = "Salary")
anim_save("2000-2013.gif", width = 1000, height = 1000) 
Average monthly pay (total pay), non-manual workers private sector (SLP),
SEK by occuptional (SSYK 2012), age, sex and year 2014-2018
214 Engineering professionals
sex=total
readfile("00000031_2.csv") %>% rowwise() %>% mutate(age2 = unlist(lapply(strsplit(substr(age, 1, 5), "-"), strtoi))[1]) %>%
rowwise() %>% mutate(age3 = unlist(lapply(strsplit(substr(age, 1, 5), "-"), strtoi))[2]) %>%
 ggplot(mapping = aes(x = year2 - (age2 + age3) / 2, y = salary)) +
   geom_point() +
   geom_smooth(method = lm, formula = y ~ splines::bs(x, 8), se = FALSE) +
   transition_time(year2) +
   labs(title = "Year: {frame_time}") +
    scale_x_continuous(name = "Year of birth") +
   scale_y_continuous(name = "Salary")
anim_save("2014-2018.gif", width = 1000, height = 1000) 
Average monthly pay (total pay), non-manual workers private sector (SLP),
SEK by occuptional (SSYK 2012), age, sex and year 2000-2013
214 Engineering professionals
sex=total
Growth of salaries by age group
csvfile <- readfile("AM0103A9.csv") %>%
  rowwise() %>%
  mutate(age2 = unlist(lapply(strsplit(substr(age, 1, 5), "-"), strtoi))[1]) %>%
  rowwise() %>% mutate(age3 = unlist(lapply(strsplit(substr(age, 1, 5), "-"), strtoi))[2])
yearwise <- group_split(csvfile %>% group_by(year2))
ageGroupGrowth = data.frame()
for (i in 1:13){
  temp <- cbind(year = 1999 + i, age = (yearwise[[i]]$age2 + yearwise[[i]]$age3) / 2, growth = yearwise[[i+1]]$relsalary / yearwise[[i]]$relsalary) - 1
  ageGroupGrowth <- rbind(ageGroupGrowth, temp)
}
ageGroupGrowth[, 'age'] <- factor(ageGroupGrowth[, 'age'])
ageGroupGrowth %>%
  ggplot(mapping = aes(x = age, y = growth)) +
  geom_bar(stat = "identity") +
  transition_time(as.numeric(year)) +
  labs(title = "Year: {frame_time}") +
  scale_x_discrete(name = "Age group") +
  scale_y_continuous(name = "Salary increase (%)")
anim_save("AgeGroupGrowth2000-2013.gif", width = 1000, height = 1000) 
Average monthly pay (total pay), non-manual workers private sector (SLP),
SEK by occuptional (SSYK 2012), age, sex and year 2000-2013
214 Engineering professionals
sex=total
Individual salary increase by birthyear, estimated from B-spline approximation
csvfile <- readfile("AM0103A9.csv") %>%
  rowwise() %>%
  mutate(age2 = unlist(lapply(strsplit(substr(age, 1, 5), "-"), strtoi))[1]) %>%
  rowwise() %>% mutate(age3 = unlist(lapply(strsplit(substr(age, 1, 5), "-"), strtoi))[2])
indGrowth = data.frame()
for (i in 2000:2012){
  yearfile <- filter(csvfile, year2 == i)
  x = yearfile$year2 - (yearfile$age2 + yearfile$age3) / 2
  model = lm(yearfile$salary ~ splines::bs(x, 8))
  X1 = data.frame(x = unlist(map2( i - 62, i - 22, seq)))
  Y1 = predict(model, X1)
  yearfile <- filter(csvfile, year2 == i + 1)
  x = yearfile$year2 - (yearfile$age2 + yearfile$age3) / 2
  model = lm(yearfile$salary ~ splines::bs(x, 8))
  X2 = data.frame(x = unlist(map2( i + 1 - 62, i + 1 - 22, seq)))
  Y2 = predict(model, X2)
  growth = Y2[1:40] / Y1[2:41]
  temp <- as_tibble(cbind(year = i+1, by=X2[1:40,1], growth=growth))
  indGrowth <- rbind(indGrowth, temp)
}
indGrowth %>%
  ggplot(mapping = aes(x = by, y = growth)) +
  geom_line() +
 transition_time(year) +
  labs(title = "Year: {frame_time}") +
  scale_x_continuous(name = "Year of birth") +
  scale_y_continuous(name = "Salary increase (%)")
anim_save("indGrowth2000-2013.gif", width = 1000, height = 1000) 
Average monthly pay (total pay), non-manual workers private sector (SLP),
SEK by occuptional (SSYK 2012), age, sex and year 2000-2013
214 Engineering professionals
sex=total
Changes in the salary structure part by birthyear, salary structure part is
defined as the derivative of the age / salary function, salary structure
part defines how much the salaries needs to increase each year so that the
structure remains unchanged.
csvfile <- readfile("AM0103A9.csv") %>%
  rowwise() %>%
  mutate(age2 = unlist(lapply(strsplit(substr(age, 1, 5), "-"), strtoi))[1]) %>%
  rowwise() %>% mutate(age3 = unlist(lapply(strsplit(substr(age, 1, 5), "-"), strtoi))[2])
salaryStructure = data.frame()
for (i in min(csvfile$year2):max(csvfile$year2)){
  yearfile <- filter(csvfile, year2 == i)
  x = yearfile$year2 - (yearfile$age2 + yearfile$age3) / 2
  model = lm(yearfile$salary ~ splines::bs(x, 8))
  X = data.frame(x = unlist(map2( i - 62, i - 22, seq, length = 100)))
  Y = predict(model, X)
  dX = rowMeans(embed(X$x, 2))
  dY = -diff(Y) / diff(X$x) / Y
  temp <- as_tibble(cbind(year = i, dX = dX, dY = dY))
  salaryStructure <- rbind(salaryStructure, temp)
}
salaryStructure %>%
  ggplot(mapping = aes(x = dX, y = dY)) +
  geom_line() +
  transition_time(year) +
  labs(title = "Year: {frame_time}") +
  scale_x_continuous(name = "Year of birth") +
  scale_y_continuous(name = "Structural increase (%)")
anim_save("salaryStructure2000-2013.gif", width = 1000, height = 1000)