Chapter 7 Engineering professionals
Average monthly pay, non-manual workers private sector (SLP) by region, occupational group (SSYK) and sex. Year 2000 - 2013
Average monthly pay (total pay), non-manual workers private sector (SLP), SEK
214 Engineering professionals
men and women
readfile ("AM0103H2.csv") %>%
  ggplot () +
    geom_line (mapping = aes (x = year2, y = salary, colour = region)) +
theme (legend.position = "bottom") 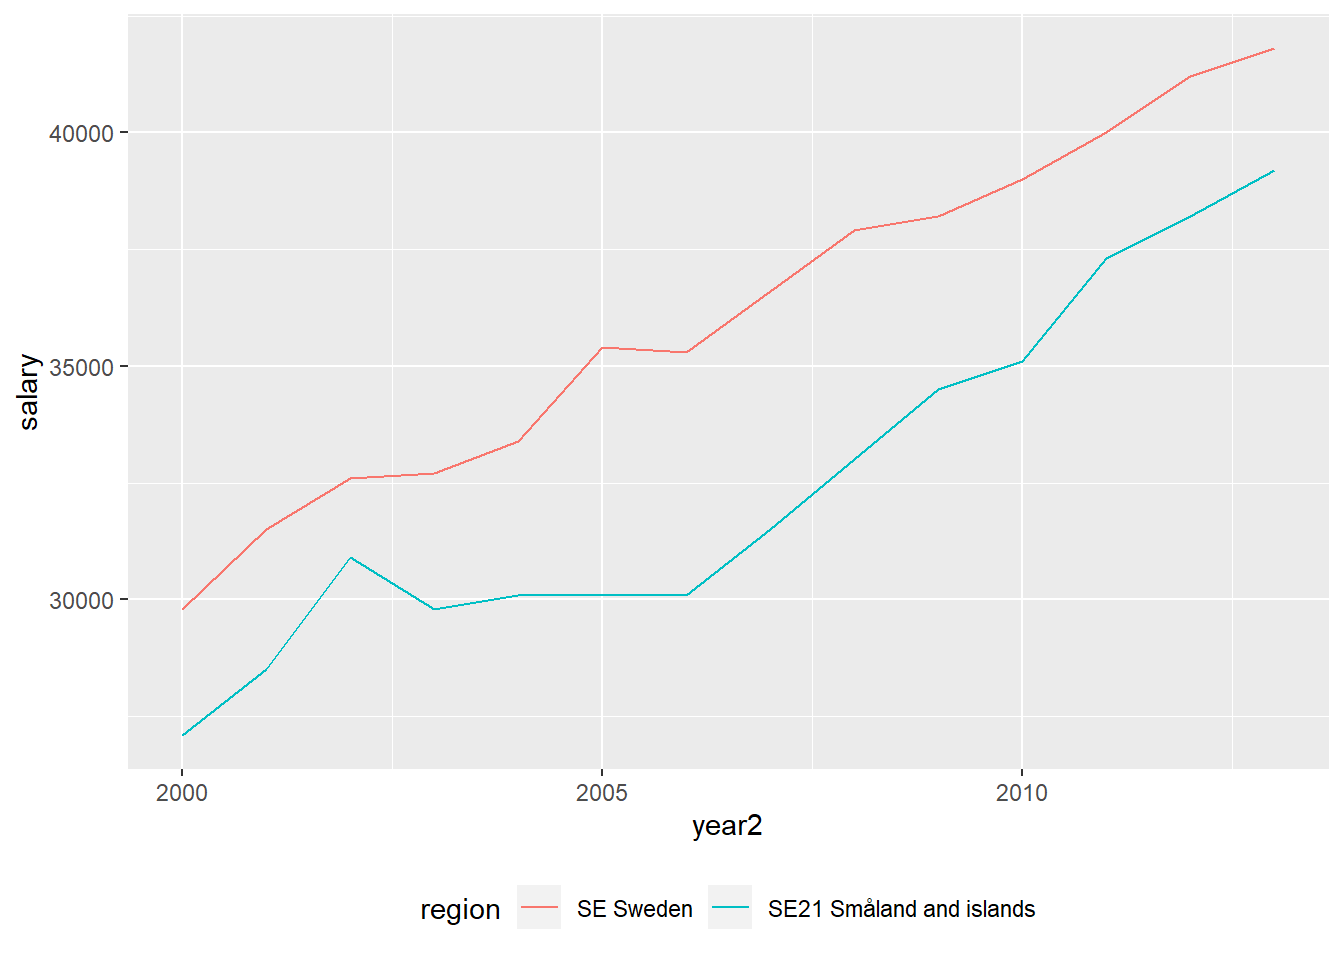
Figure 7.1: Engineering professionals, Year 2000 - 2013
readfile ("AM0103H2.csv") %>%
  group_by (region) %>%
  mutate (growth = c (NA, diff(salary)) / salary) %>%
  ggplot () +
    geom_line (mapping = aes(x = year2, y = growth, colour = region)) +
    theme (legend.position = "bottom")
## Warning: Removed 2 rows containing missing values (geom_path).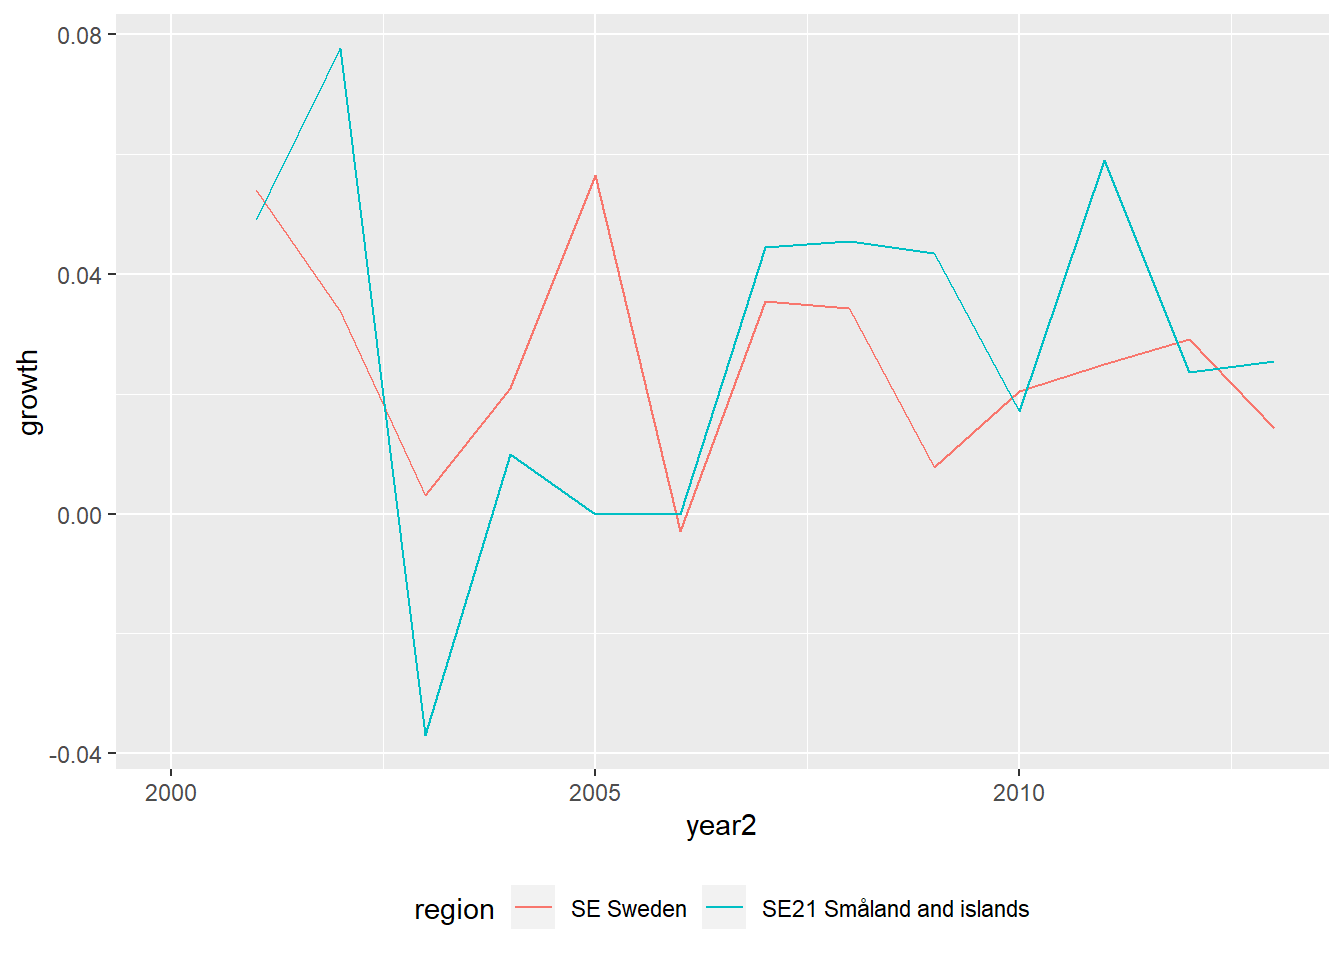
Figure 7.2: Engineering professionals, Year 2000 - 2013
Average monthly pay, non-manual workers private sector (SLP) by region, occupational group (SSYK 2012) and sex. Year 2014 - 2018
Average monthly pay (total pay), non-manual workers private sector (SLP), SEK
214 Engineering professionals
men and women
readfile ("0000002T.csv") %>%
  ggplot () +
    geom_line (mapping = aes (x = year2, y = salary, colour = region)) +
theme (legend.position = "bottom") 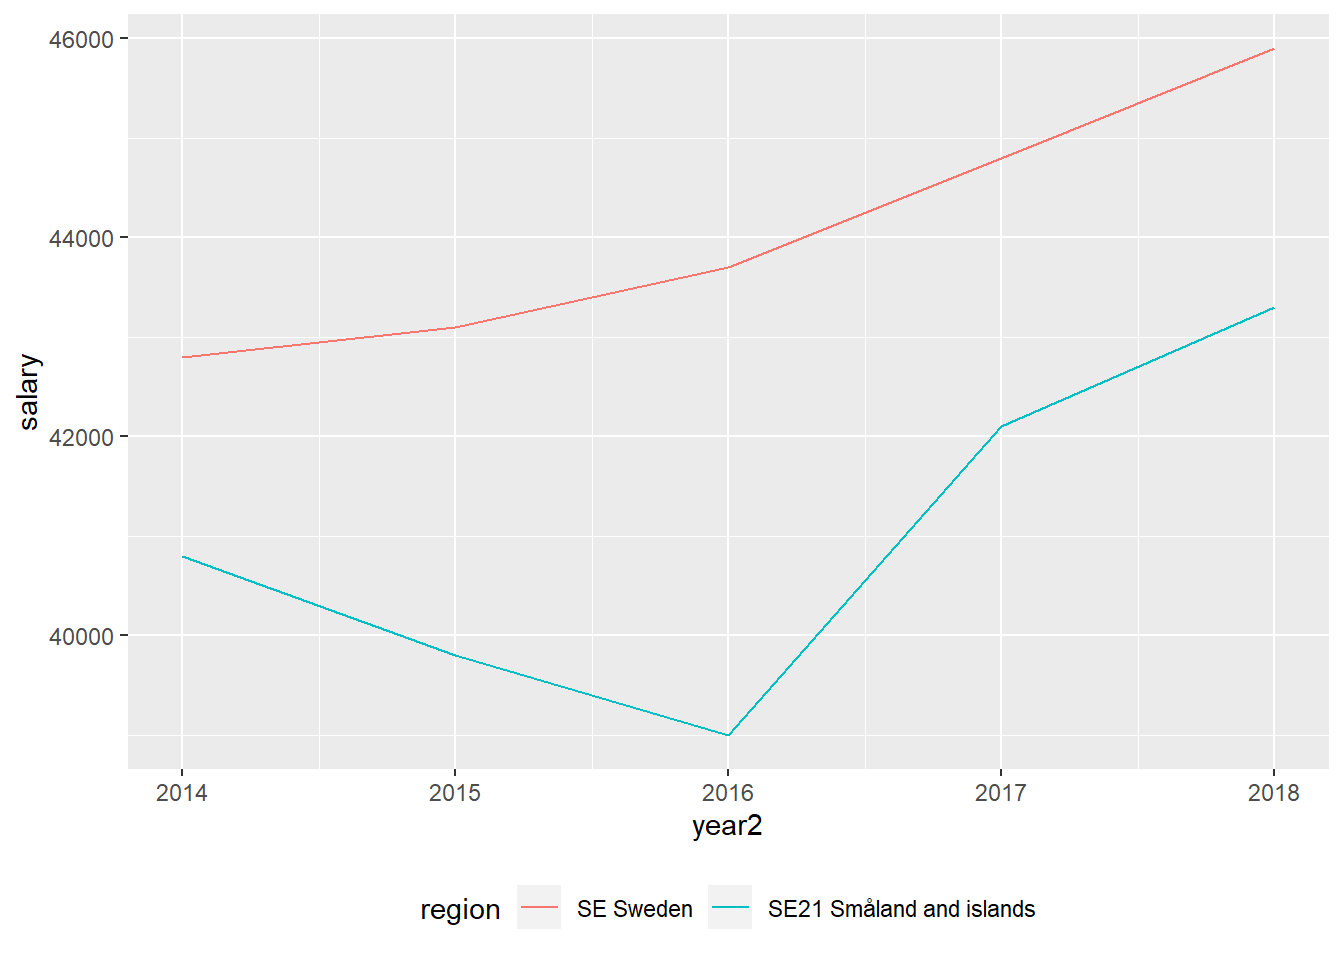
Figure 7.3: Engineering professionals, Year 2014 - 2018
readfile ("0000002T.csv") %>%
  group_by (region) %>%
  mutate (growth = c (NA, diff(salary)) / salary) %>%
  ggplot () +
    geom_line (mapping = aes(x = year2, y = growth, colour = region)) +
    theme (legend.position = "bottom")
## Warning: Removed 2 rows containing missing values (geom_path).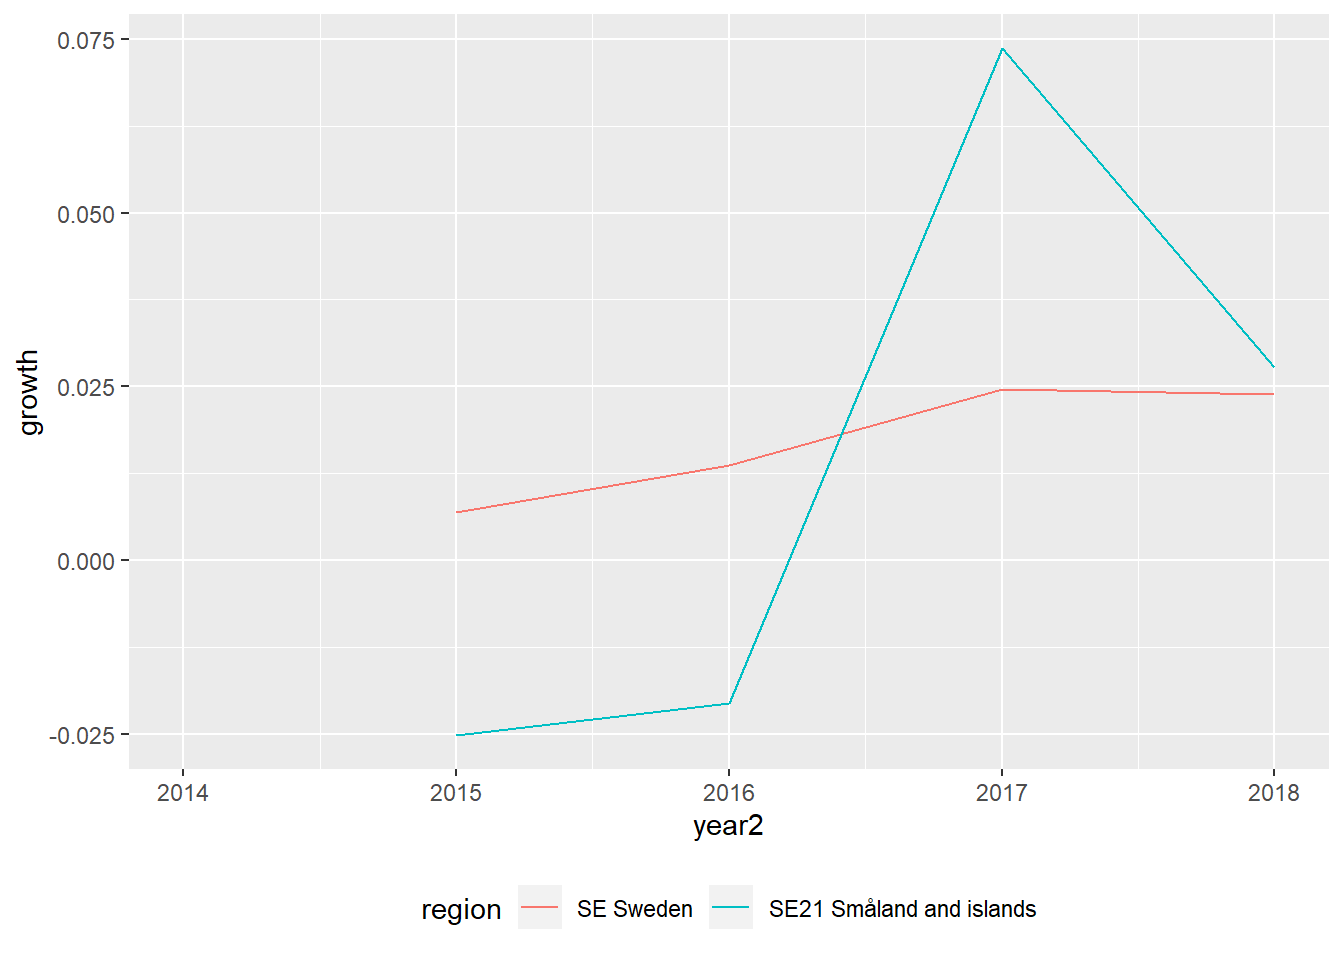
Figure 7.4: Engineering professionals, Year 2014 - 2018